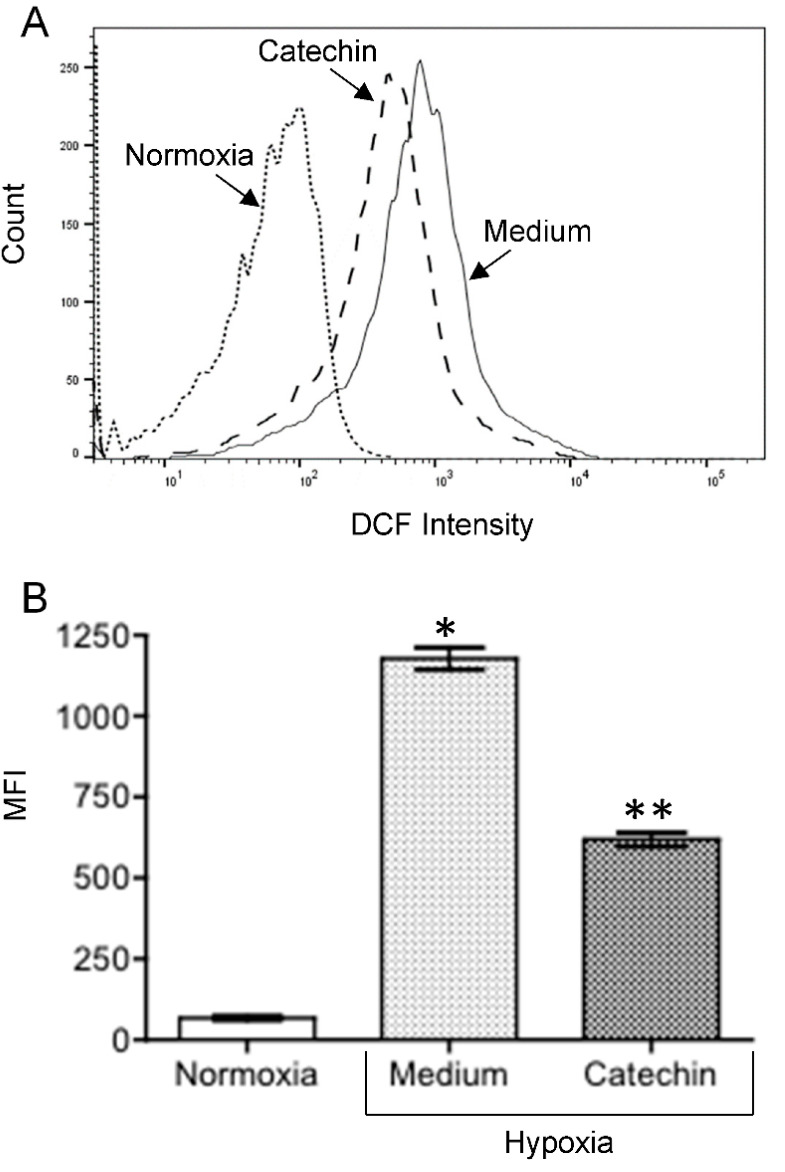
Figure 3.
Effect of catechin on ROS levels in hypoxic HKC-8 cells. HKC-8 cells in 24-well plates were incubated in an atmosphere containing 1% O2 (hypoxia) or 20% O2 (normoxia) in the absence or presence of 100 µM catechin for 72 h. ROS was measured using FACS analysis with DCF-DA staining. (A) Typical FACS graphs showing the intensity of oxidized DCF fluorescence: dotted line—Normoxia; solid line;—hypoxia with medium; broken line—hypoxia with catechin. (B) Data of MFI (mean fluorescent intensity) are presented as mean ± SD of three determinants. * p < 0.0001 (Medium vs. Normoxia, two-tailed t-test), ** p < 0.0001 (Catechin vs. Medium, two-tailed t-test).

