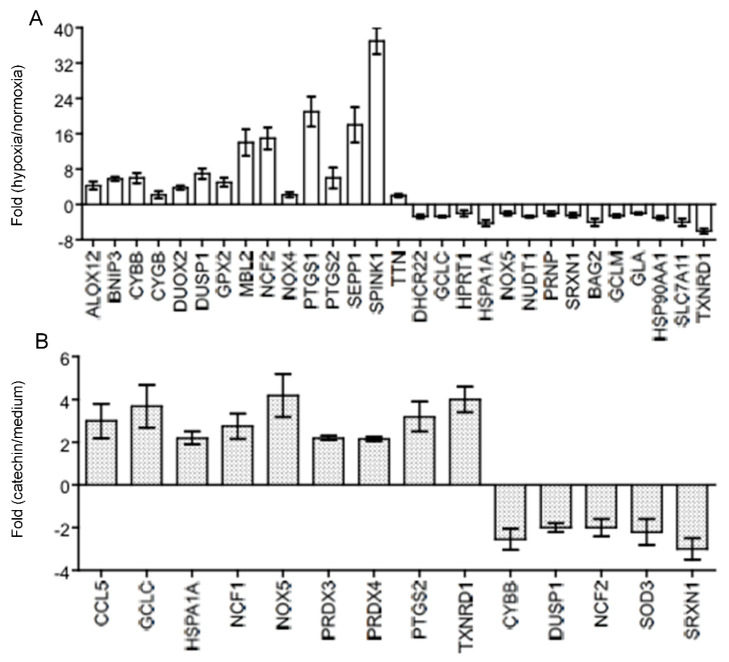
Figure 5.
The expression of oxidative stress-related genes in hypoxic HKC-8 cells in the absence or presence of 100 µM of catechin. After 72 h of incubation, the gene expression was determined using PCR array analysis compared with the expression of housekeeping genes (Table S1). (A) Fold changes of gene expression in hypoxia compared with in normoxia, (B) Fold changes of gene expression in catechin-treated hypoxic cells compared with in untreated (medium) hypoxic cells. These genes were chosen as their differences between hypoxia and normoxia or catechin-treated and medium were ≥2-fold and statistically significant (p < 0.05, two-tailed t-test, n = 3). This experiment was repeated three times in triplicate using independently prepared cDNAs, and the results were exhibited in almost identical patterns.

