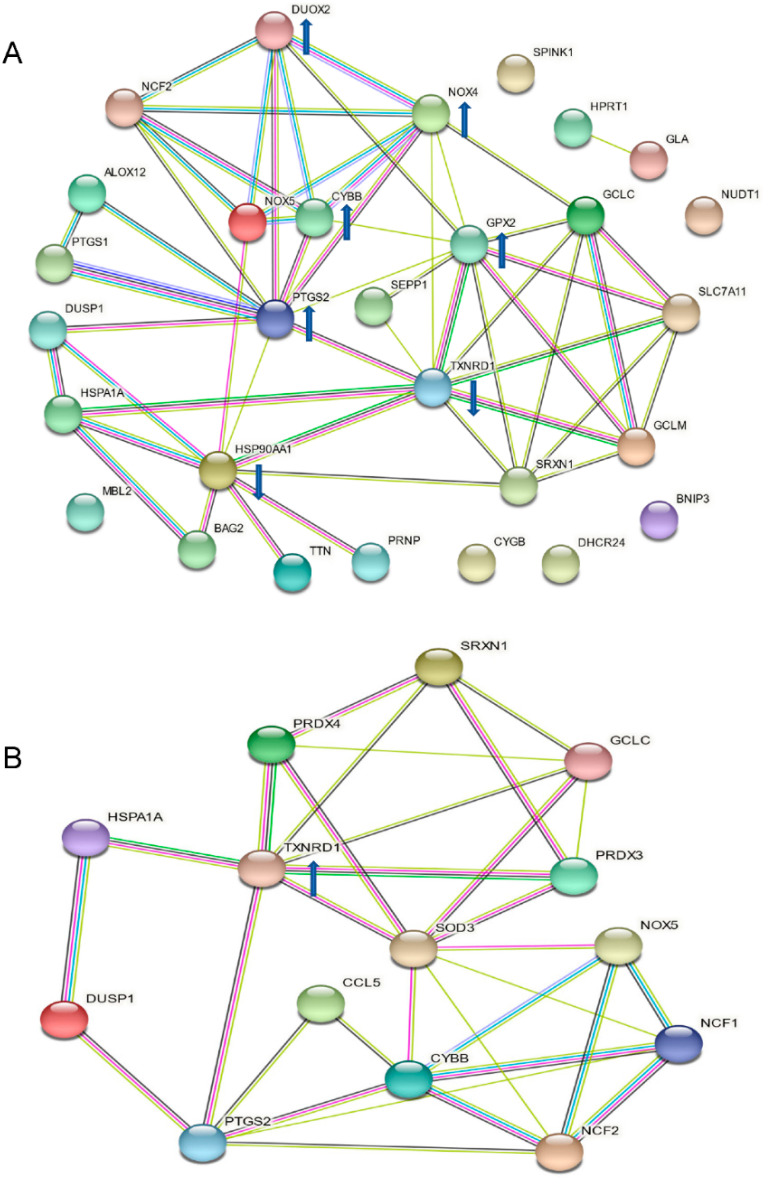
Figure 6.
Interaction networks of affected oxidative stress-related molecules in HKC-8 cells in hypoxia or treated with catechin. The interaction networks of genes in Figure 2 were analyzed using STRING databases: (A) the interaction network of oxidative stress-related molecules in hypoxic HKC-8 cells; (B) the interaction network of oxidative stress molecules affected by catechin treatment in hypoxic HKC-8 cells. Known interactions: green line (from curated databases) and purple line (experimentally determined), predicted interactions: lime line (gene neighborhood), red line (gene fusion) and blue line (gene co-occurrence), and others: yellow line (textmining), indigo line (co-expression) and grey line (protein homology). Arrow pointing up: upregulated, arrow pointing down: downregulated.

