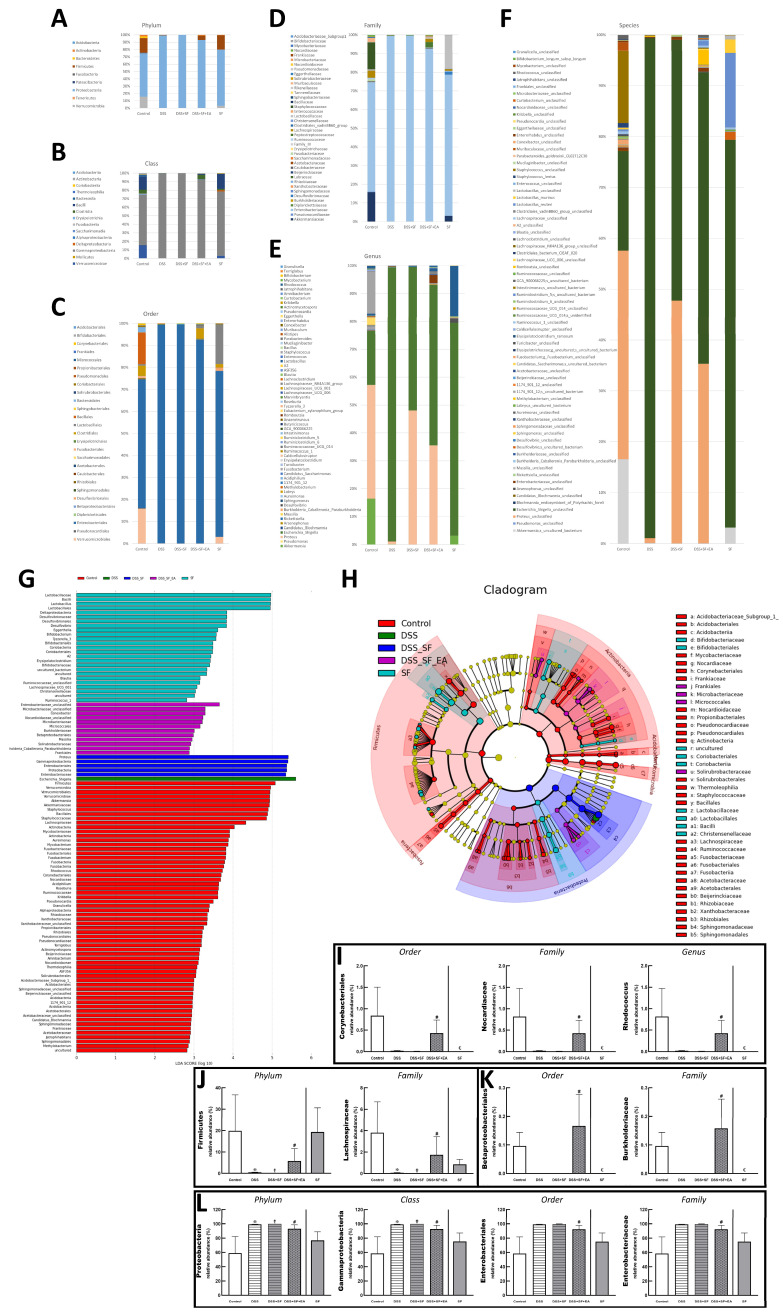
Figure 6.
EA alters the intestinal microbial composition in DSS colitis mice with sleep fragmentation. Microbial community bar plot by (A) phylum, (B) class, (C) order, (D) family, and (E) genus. (G) LEfSe (Linear discriminant analysis effect size). Comparisons of the relative abundance at the level of bacterial phylum. Each bar represents the effect size (LDA) for a particular taxa in a certain group. The length of the bar represents a log10 transformed LDA score. The colors represent which group that taxa was found to be more abundant compared to the other group. (H) LEfSe Cladogram. The green-group positive-enriched taxa are indicated with a positive LDA score (green) and red-group control-enriched taxa have a negative score (red). Only the taxa with meeting a significant LDA threshold value of >2 are shown. (I–L) Comparison of five groups in the specific microorganisms and their subordinates. (I) Comparison of five groups in the genus Rhodococcus and its superior (family and order) in bar charts. (J) Comparison of five groups in the family Lachnospiraceae and its superior (family and phylum) in bar charts. (K) Comparison of five groups in the family Burkholderiaceae and its superior (family and order) in bar charts. (L) Comparison of five groups in the family Enterobacteriaceae and its superior (order, class, and phylum) in bar charts. Samples of the control group, DSS group, DSS + SF group, DSS + SF + EA group, and SF group were represented by groups (colored by each group name). ✠,✟, #, and € represent the results of control group versus DSS group, DSS group versus DSS + SF group, DSS + SF group versus DSS + SF + EA group, and control group versus SF group, respectively. ✠, ✟, #, €, p < 0.05. ((A–L), n = 4 in each group). DSS, dextran sodium sulfate; SF, sleep fragmentation; EA, electroacupuncture.

