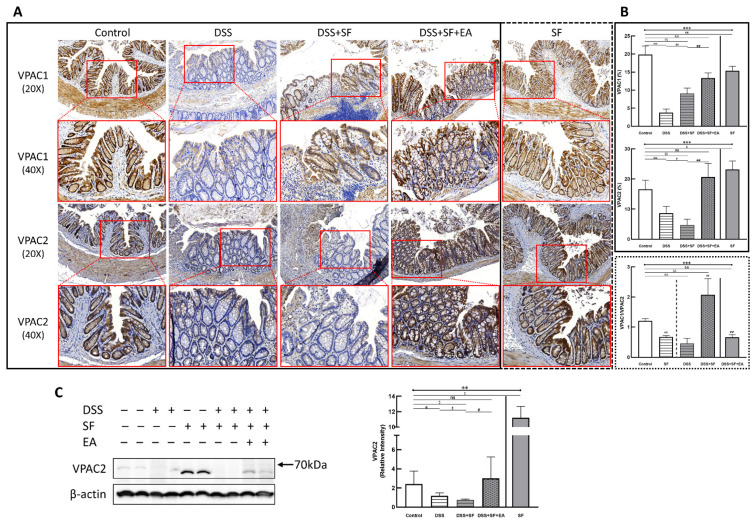
Figure 7.
Vasoactive intestinal peptide receptors in mice colon during DSS colitis with sleep fragmentation. (A) Immunohistochemical (IHC) staining of VPAC1 and VPAC2 in colon sections. Upper part: expression of VPAC1 in colon tissue of different groups at 200× & 400× magnification. Comparison of the VPAC1 in five groups was shown in (B) right upper panel. (A) Lower part: expression of VPAC2 in colon tissue of different groups at 200× & 400× magnification. Comparison of the VPAC2 in five groups was shown in (B) right middle panel. Comparison of VPAC1/VPAC2 ratios by sleep fragmentation in normal and inflamed state was shown in (B) right lower panel. Quantification of area percentage of IHC staining by true color image analysis with the application of adjusted thresholds. (C) Western blot analysis of VPAC2 and β-actin (loading control) in colon homogenates. Right graph indicates quantification relative to β-actin. * Stands for a result of five groups comparison (represented by bold line segments with endpoints) The uncropped western blot figures were presented in Figure S1. The densitometry readings/intensity ratio of VPAC2 in western blots in DSS-colitis mice with sleep fragmentation were presented in Table S3. ✠, ✟, #, $, & and € represent the results of control group versus DSS group, DSS group versus DSS + SF group, DSS + SF group versus DSS + SF + EA group, control group versus DSS + SF group, control group versus DSS + SF + EA group, and control group versus SF group, respectively (represented as a thin line without endpoints).*, ✠, ✟, #, $, &, €, p < 0.05; **, ✠✠, ✟✟, ##, $$, &&, €€ p < 0.01; ***, p < 0.001; ns, no significance. Data were presented as mean ± SEM of repeated adjusted thresholds in each group. VPAC1, vasoactive intestinal peptide (VIP) type 1 receptor; VPAC2, vasoactive intestinal peptide (VIP) type 2 receptor; DSS, dextran sodium sulfate; SF, sleep fragmentation; EA, electroacupuncture.

