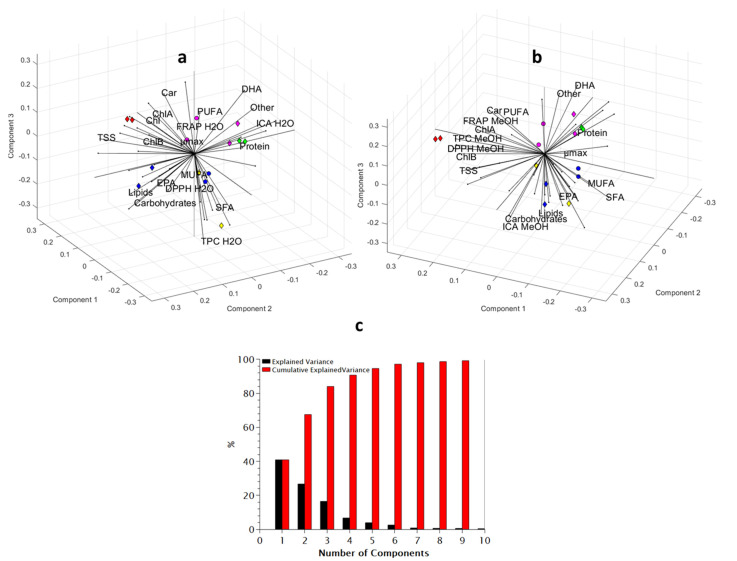
Figure 5.
(a,b) * ** Biplots of the first three PCA components on proximate composition (84.07% of the explained variance). EPA and DHA here represent the percentage in the dry biomass, while SFA, MUFA, and PUFA are percentages in the total lipids. Markers represent data (color indicates species and marker type indicates growth phase) and are grouped by similarity. The variation of data is expressed by the position of datapoints in a three-dimensional plot of three components that are composed of all the characteristics under analysis. Lines that originate from the origin of the graph represent the characteristics used to synthesize the principal components. The length of each line is proportional to the contribution of the corresponding characteristic to the principal components. The angle between two lines indicates positive (close to 0°), negative (close to 180°) or no (close to 90°) correlation between the variables. Red: C. minutissima, yellow: D. salina, green: I. galbana, blue: N. oculata, purple: T. lutea, circles: early stationary phase, diamonds: late stationary phase. (c) The explained variance and explained cumulative variance as a function of the number of components. * TPC and antioxidant data of aqueous and methanolic extracts have been omitted from a and b, respectively, for clarity. ** Other data used for PCA were also omitted for clarity. The full data set and 3D figure can be found in the supplementary materials.

