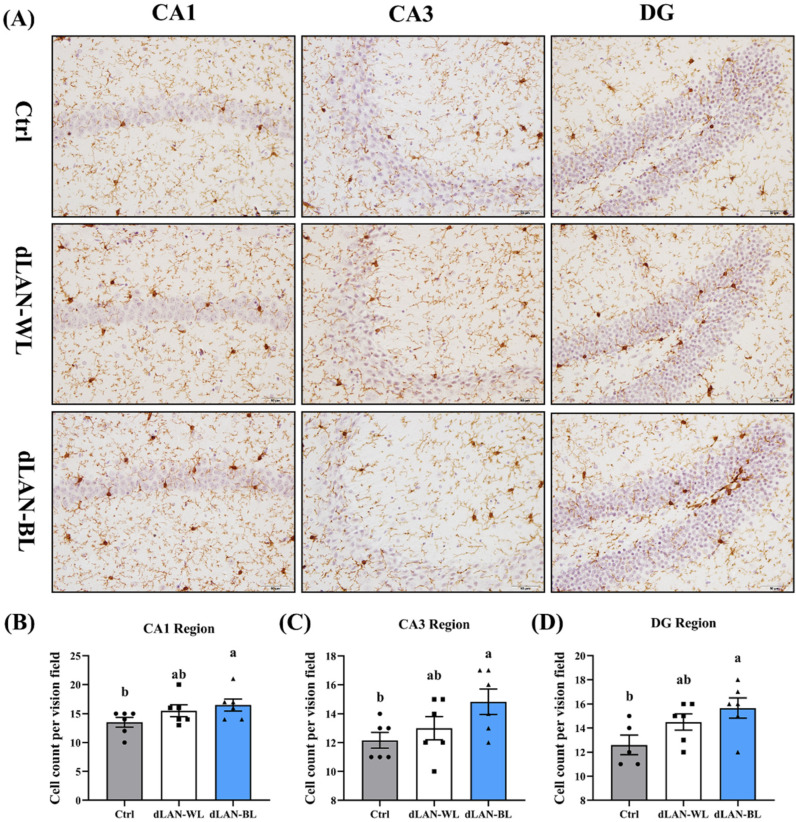
Figure 4.
Effects of dLAN on the number of microglia in the CA1, CA3 and DG regions of the hippocampus. (A) Images of the immunohistochemical microglia in the different groups. The immunohistochemical results were processed using Image J. Bar =50 μm. (B) Number of microglia in the hippocampal CA1 region (n = 6). (C) Number of microglia in the hippocampal CA3 region (n = 6). (D) Number of microglia in the hippocampal DG region (n = 6). Differences were assessed using one-way ANOVA. The result represents the mean ± standard error of the mean. Values not sharing a common superscript letter (a,b) differ significantly at p < 0.05; those with the same letter (a,b) do not differ significantly (p ≥ 0.05). Ctrl: control group, dLAN-WL: dim white light at night group, dLAN-BL: dim blue light at night group.

