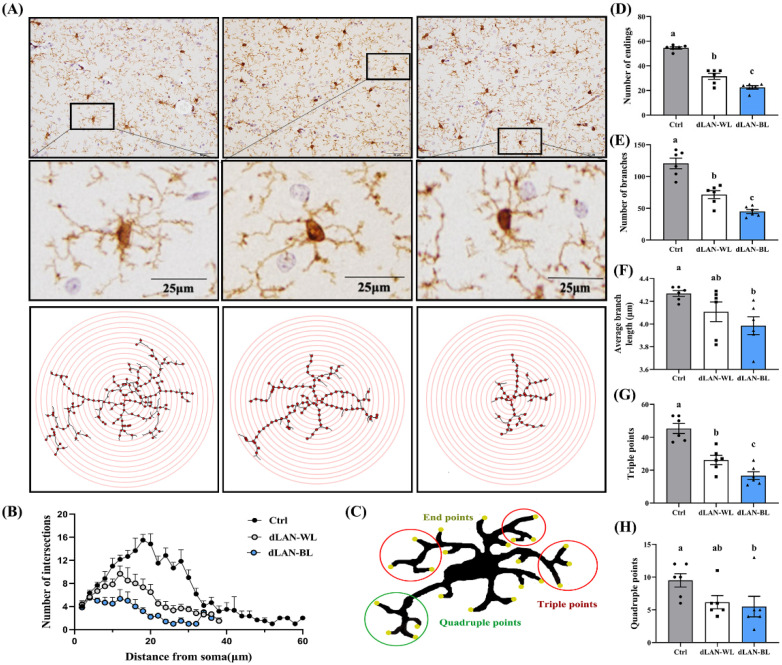
Figure 5.
Effects of dLAN on microglia morphology in the hippocampus. (A) Schematic diagram of Sholl analysis. The results of Sholl analysis were processed using ImageJ. Bar = 25 μm. (B) Quantification of microglial ramification complexity using Sholl analysis (n = 6). (C) Schematic example of a skeletonized microglia showing endpoints, triple junctions (junctions with exactly three branches) and quadruple junctions (junctions with exactly four branches). (D) Analysis of the microglial endpoints (n = 6). (E) Analysis of the microglial branches (n = 6). (F) Analysis of the average branch length of microglia (n = 6). (G) Analysis of the triple points of microglia (n = 6). (H) Analysis of the quadruple points of microglia (n = 6). Differences were assessed using one-way ANOVA. The result represents the mean ± standard error of the mean. Values not sharing a common superscript letter (a,b) differ significantly at p < 0.05; those with the same letter (a,b) do not differ significantly (p ≥ 0.05). Ctrl: control group, dLAN-WL: dim white light at night group, dLAN-BL: dim blue light at night group.

