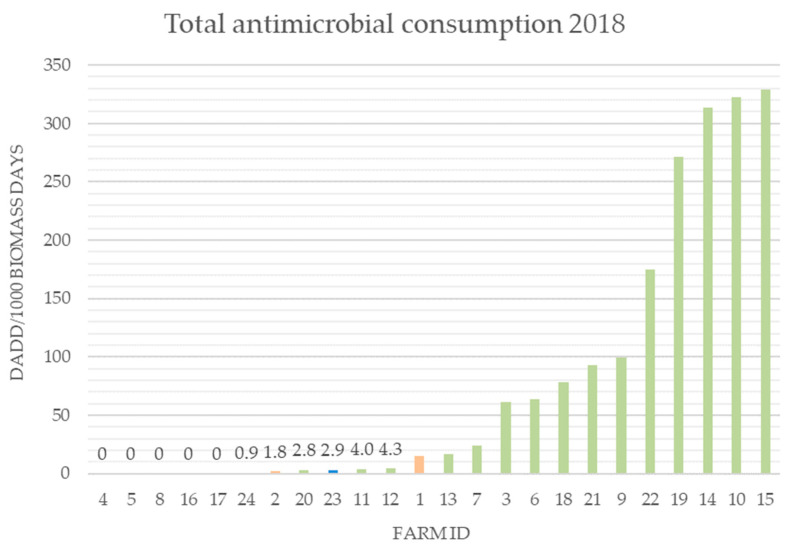
Figure 2.
Total antibiotic consumption in 2018 on the included farms (DK n = 20, IS n = 2, NL n = 2). DADD: defined daily animal dose, the assumed average dose needed to treat a 1 kg animal; biomass days calculated as in Jensen et al. [16]. Farms 1 and 2 are Dutch (orange). Farms 23 and 24 are Icelandic (blue). Green farms are Danish.

