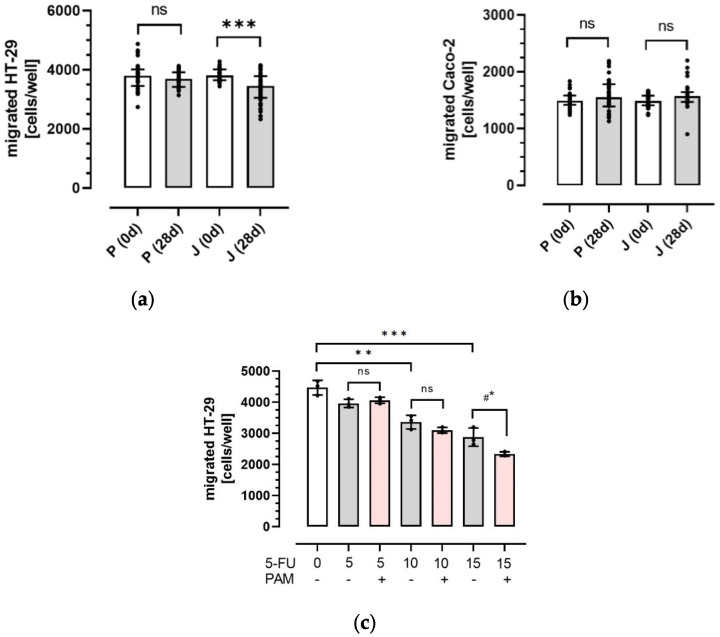
Figure 2.
Migration of HT-29 and Caco-2 cells in vitro. HT-29 (a) and Caco-2 (b) cells were incubated with PAM from the anthocyanin-depleted placebo (P; n = 34) and anthocyanin-rich juice (J; n = 35) that were isolated before (0 d) and after 28-day (28 d) intervention. Migration was studied in a Boyden chamber with collagen-coated transwells. Basal cells in the lower chamber were measured after 36 h and migrated cell counts were detected fluorometrically as described in the Methods section. HT-29 cells (c) were exposed to indicated concentrations of 5-FU alone (5, 10, and 15 µM) and with pooled PAM (n = 10; most effective from (a)). Values are presented as aligned dot plots with median and interquartile range (25th–75th) (a,b) or means with standard deviation (c). Significant differences were calculated with a mixed model with multiple comparison test (Šídák’s) or ANOVA with multiple comparison test (Šídák’s). Values were different with ** p < 0.01 and *** p < 0.001 compared with the corresponding controls or with #* p < 0.05 compared with 5-FU (15 µM) alone. ns, non significant.

