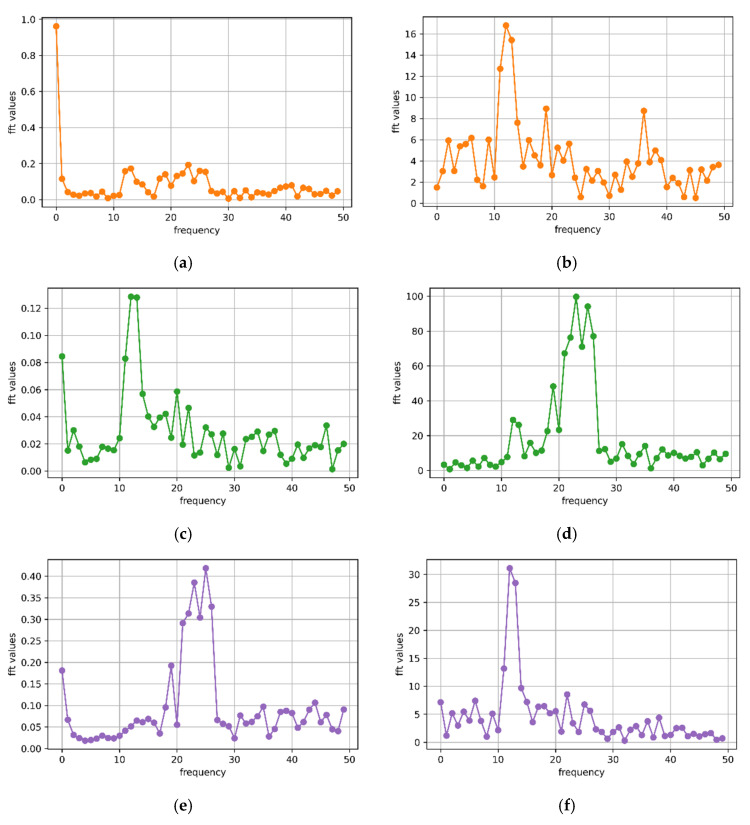
Figure 7.
Fourier transform analysis of three-axis accelerometer and three-axis gyroscope signals for 5 s of running behavior, as shown in Figure 6, calculating the main frequency and period. (a) x-axis accelerometer: n = 23; N = 100; f = 4.4 Hz; T ≈ 0.23 s; (b) x-axis gyroscope: n = 12; N = 100; f = 2.2 Hz; T ≈ 0.45 s; (c) y-axis accelerometer: n = 12; N = 100; f = 2.2 Hz; T ≈ 0.45 s; (d) y-axis gyroscope: n = 23; N = 100; f = 4.4 Hz; T ≈ 0.23 s; (e) z-axis accelerometer: n = 25; N = 100; f = 4.8 Hz; T ≈ 0.21 s; (f) z-axis gyroscope: n = 12; N = 100; f = 2.2 Hz; T ≈ 0.45 s.

