Table 9.
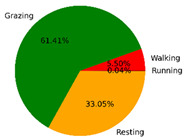
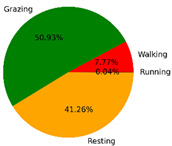
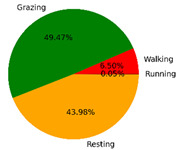
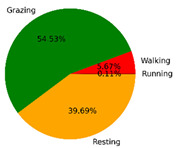
Percentage of behavior time of the three grazing sheep for 7.5 h on pasture with three different sward surface heights (SSH).
| SSH | B-Sheep | P-Sheep | R-Sheep | Average Proportion | |
|---|---|---|---|---|---|
| Short |
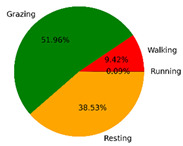
|
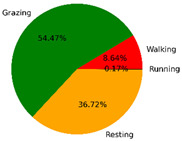
|
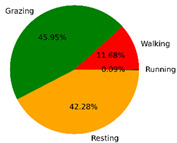
|
Walking | 9.91% |
| Grazing | 50.79% | ||||
| Resting | 39.18% | ||||
| Running | 0.12% | ||||
| Medium |
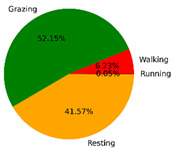
|
|
|
Walking | 6.50% |
| Grazing | 54.83% | ||||
| Resting | 38.63% | ||||
| Running | 0.04% | ||||
| Tall |
|
|
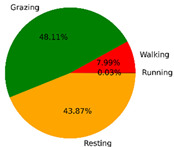
|
Walking | 6.72% |
| Grazing | 50.70% | ||||
| Resting | 42.52% | ||||
| Running | 0.06% | ||||
