Figure 2.

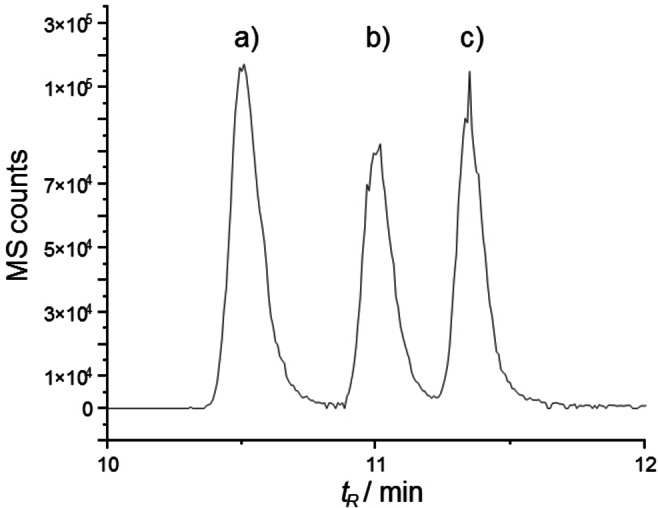
Extracted ion chromatogram (MS range: 1295.8±0.5) of a mixed sample containing synthesized compounds 2 and 5 and isolated orfamide A (NP). a) 2, b) 5, c) NP. See Supporting Information for experimental details.

Extracted ion chromatogram (MS range: 1295.8±0.5) of a mixed sample containing synthesized compounds 2 and 5 and isolated orfamide A (NP). a) 2, b) 5, c) NP. See Supporting Information for experimental details.