Figure 7.

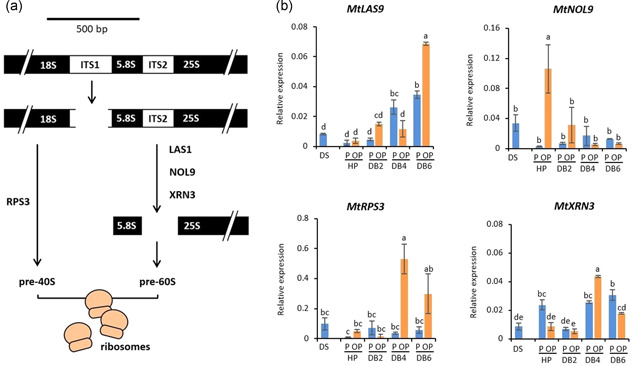
(a) Schematic representation of ribogenesis. (b) Expression profiles of MtLAS1, MtNOL9, MtXRN3, MtRPS3 genes, qRT‐PCR data were analysed with two‐way ANOVA and TUKEY test. Means without common letters are significantly different (p < 0.05)

(a) Schematic representation of ribogenesis. (b) Expression profiles of MtLAS1, MtNOL9, MtXRN3, MtRPS3 genes, qRT‐PCR data were analysed with two‐way ANOVA and TUKEY test. Means without common letters are significantly different (p < 0.05)