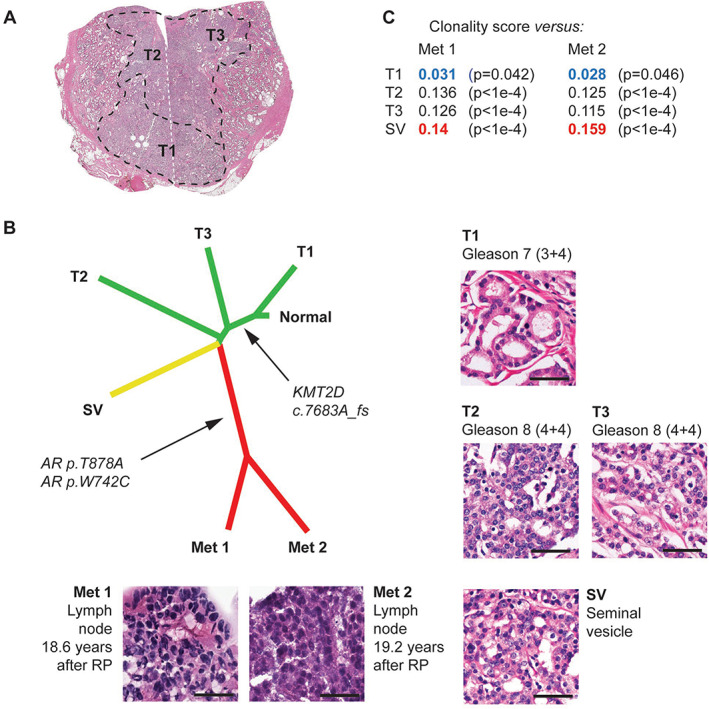
Figure 4.

A summary of pathology features, phylogeny, and clonality analyses for Patient 9. (A) Low‐power pathology view. This case was interpreted as a unifocal, monoclonal tumor, albeit with the T1 tumor area showing a lower Gleason grade than areas T2 and T3. This low‐power view is a montage of low‐power views from two distinct pathology slides, taken at the same level and thus representing one complete section of the specimen. The white dashed line indicates where the two images have been assembled. (B) Phylogenetic reconstruction using 71 genes and 103 events, confirming that samples T2, T3, and seminal vesicle (SV) are more closely related to the metastasis than T1. Detailed histomorphology for all foci is also shown. (C) A summary of clonality score results. Sample SV shows the highest clonality score (highlighted in red) with respect to both metastatic samples. Note that sample T1 (with the lowest individual Gleason score) also shows the lowest clonality score (highlighted in blue).
