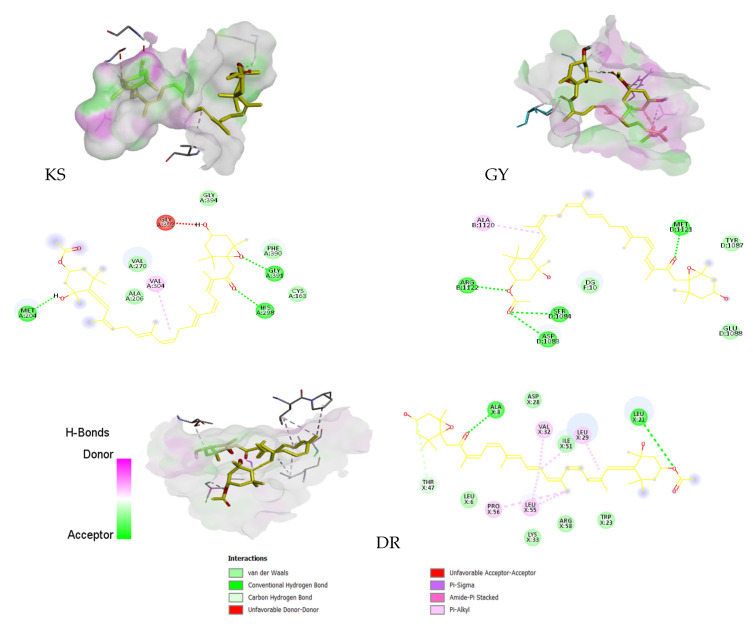
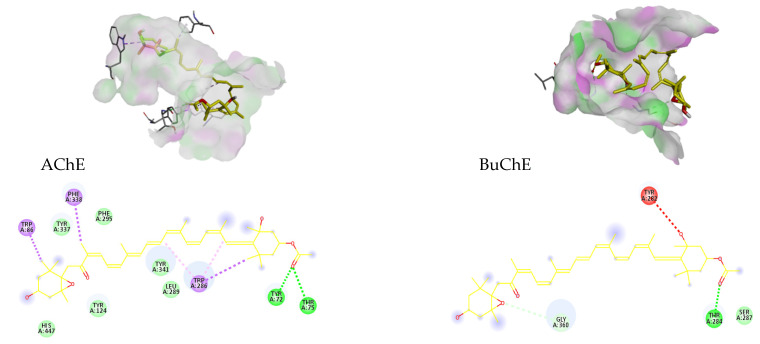
Figure 5.
Representation of the molecular interactions between Fx and beta-ketoacyl-ACP I synthase, dihydrofolate reductase, gyrase acetylcholinesterase, and butyrylcholinesterase after docking. In yellow, the integration of Fx with the protein’s active center can be seen. In violet, the donor regions of hydrogen bonds can be seen, and in green, the accepters can be seen. We can also observe the distinct types of interactions between the residues involved in the molecular junction (represented by dashed lines in different colors according to each type).


