
Fig. 5.
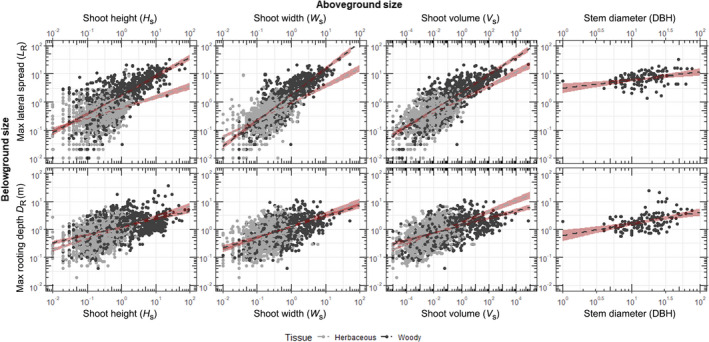
Scatter plots of plant root extents (L R, upper; D R, lower) against aboveground plant extents (H S, shoot height; W S, shoot width; V S, shoot volume; DBH, stem Diameter), with woody plants in dark gray and herbaceous plants in light gray. Shoot volume is calculated using the equation . The dashed lines (woody in dark gray and herbs in light gray) represent a linear regression where P < 0.05 in the form of y = β + α × x, and the red shaded regions are the 95% confidence interval. The statistics and the parameters for the linear regressions are in Table 3. The axes scales are in common log10.