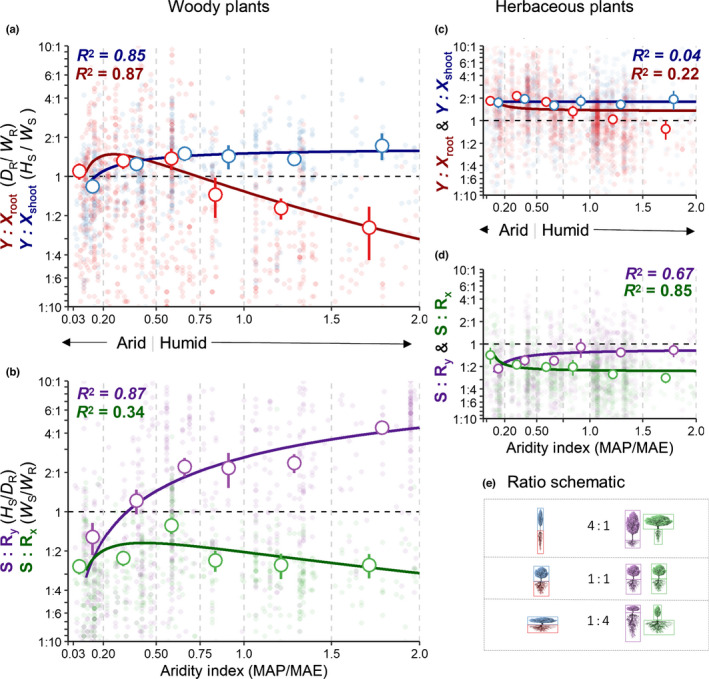
Fig. 7.

Woody plant shapes diverge across aridity classes. Point range represents the mean and confidence intervals grouped by aridity index categories for the four shape ratios with fitted nonlinear regressions. (a) Dimensional aspect ratios for woody plants, (b) shoot : root ratios for woody plants, (c) dimensional aspect ratios for herbaceous plants, and (d) shoot : root ratios for herbaceous plants. Either log‐normal () or nonlinear saturation curves () were fitted to the means of each shape ratio across aridity classes, and the R 2 values are stated (see Supporting Information Table S5 for full equations). The aridity index categories, delimited by light gray dashed lines, are arid (0–0.2), semi‐arid (0.2–0.5), subhumid (0.5–0.75), humid (0.75–1.0), per‐humid (1.0–1.5), and hyper‐humid (1.5–2.0). The dashed black line represents ratio values equal to one. (e) The color‐coded schematics represent the relative dimensions for each ratio value. MAP, mean annual precipitation; MAE, mean annual potential evapotranspiration; D R, max rooting depth; W R, root system width, H S, shoot height; W S, shoot width.
