Figure 3.

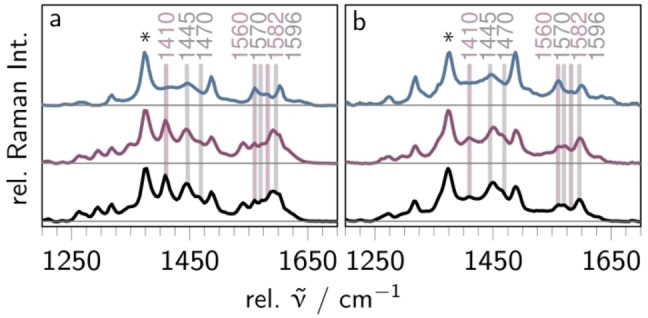
Resonance Raman spectra of Ru (bottom, black), RuH+ (middle, violet), and RuH2 (top, blue) in acetonitrile upon 405 nm (a, 4 mW) and 473 nm (b, 5 mW) excitation. The spectra are normalized to the solvent band at 1373 cm−1 (asterisk).

Resonance Raman spectra of Ru (bottom, black), RuH+ (middle, violet), and RuH2 (top, blue) in acetonitrile upon 405 nm (a, 4 mW) and 473 nm (b, 5 mW) excitation. The spectra are normalized to the solvent band at 1373 cm−1 (asterisk).