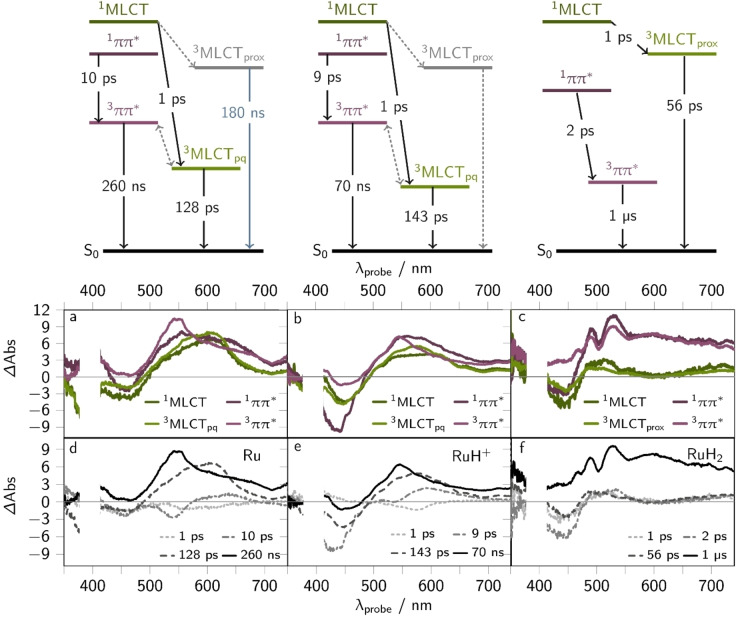
Figure 5.
Species associated spectra (SAS, a–c) and their corresponding reconstructed decay associated spectra (DAS, d–f) of the fs‐TA data of Ru (left), RuH+ (middle), and RuH2 upon 400 nm excitation (0.4 mW) in acetonitrile. The employed target models are shown on top. States (solid lines) and processes (dotted lines) that are not included in the target model are shown in grey in the Jablonski diagrams: Since the ππ* excited states dominate the TA signals the proximal MLCT states (MLCTprox: MLCTbpy and MLCTphen), which typically show strong GSB between 400 and 450 nm and weak ESA ranging from 500 to 750 nm, were not included in the target models (cf. grey states and dashed lines in the Jablonski schemes). The DAS were qualitatively constructed from the SAS by: DAS(k1)=SAS(1MLCT) – SAS(3MLCT), DAS(k2)=1ππ*– 3ππ*, DAS(k3)=SAS(3MLCT), DAS(k4)=SAS(3ππ). The DAS obtained by fitting the data within a parallel model are shown in Figure S11.

