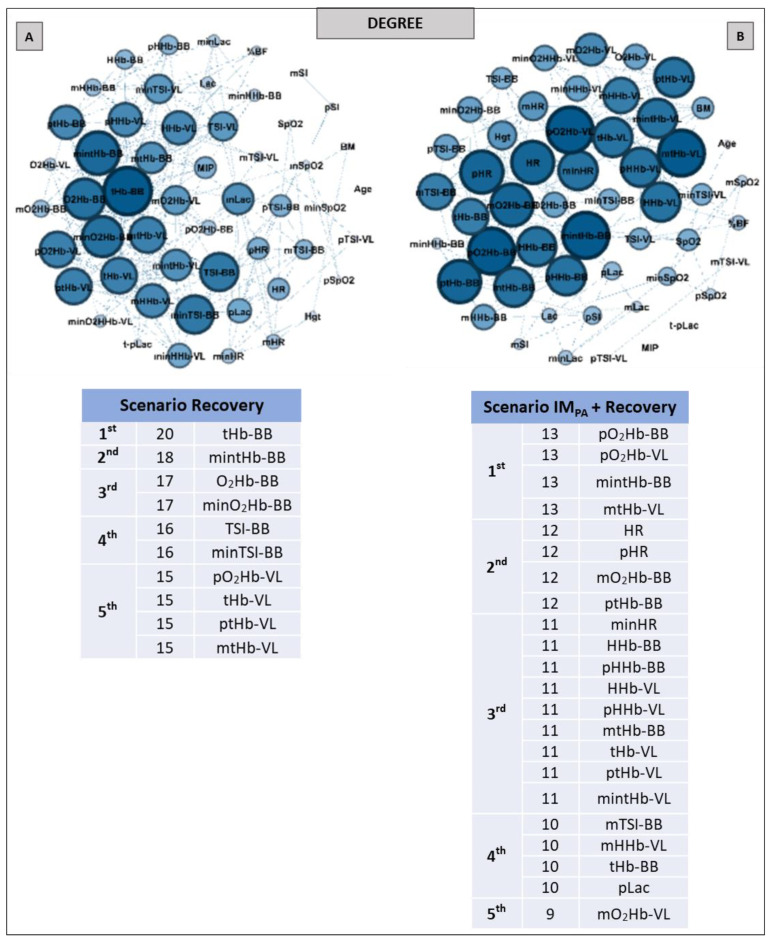
Figure 5.
Graphs and top five node results obtained by complex network analysis using the Degree metric in two recovery scenarios: without inspiratory muscle pre-activation (Scenario Recovery, at Panel A) and with inspiratory muscle pre-activation (Scenario IMPA + Recovery, at Panel B). Graph visualizations were done using Gephi software (version 0.9.2, Paris, France). Legend: AO30 = all-out 30 s, IMPA = inspiratory muscle pre-activation, Hgt = height, BM = body mass, %BF = percent body fat, MIP = maximal inspiratory pressure, SI = global strength index of inspiratory muscles, Lac = blood lactate, HR = heart rate, SpO2 = arterial oxygen saturation, O2Hb = oxyhemoglobin relative concentration, HHb = deoxyhemoglobin relative concentration, tHb = total hemoglobin, TSI = tissue saturation index. Abbreviations accompanied by p, m and min represent peak, mean and minimum values, respectively. Abbreviations accompanied by BB and VL represent the results in the biceps brachii and vastus lateralis, respectively.

