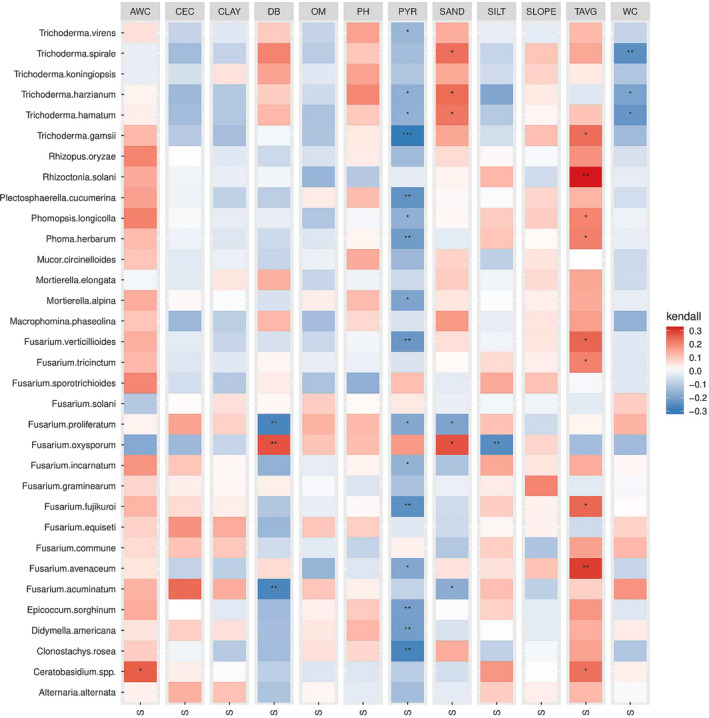
FIGURE 6.

Heatmap showing correlations between environmental and soil edaphic factors with the top abundant fungal species isolated from diseased seedlings. Colours represent Kendall’s correlation coefficients (τ) (Kendall & Gibbons, 1990) between relative abundances of the top fungal species and environmental parameters. Asterisks (*) indicate the significance level for Kendall’s rank correlation (p <0.05*, 0.01**, 0.001***). AWC: available water capacity (cm water/cm soil), CEC: cation exchange capacity (milliequivalents/100 g of soil at pH 7.0), CLAY: clay content (%), DB: soil bulk density 1/3 bar (g/cm3), OM: soil organic matter (%), PH: soil pH, PYR: precipitation year (ml), SAND: sand content (%), SILT: silt content (%), SLOPE: slope (°C), TAVG: temperature year (°C), WC: water content 1/3 bar (volumetric percentage of the whole soil)
