FIGURE 7.

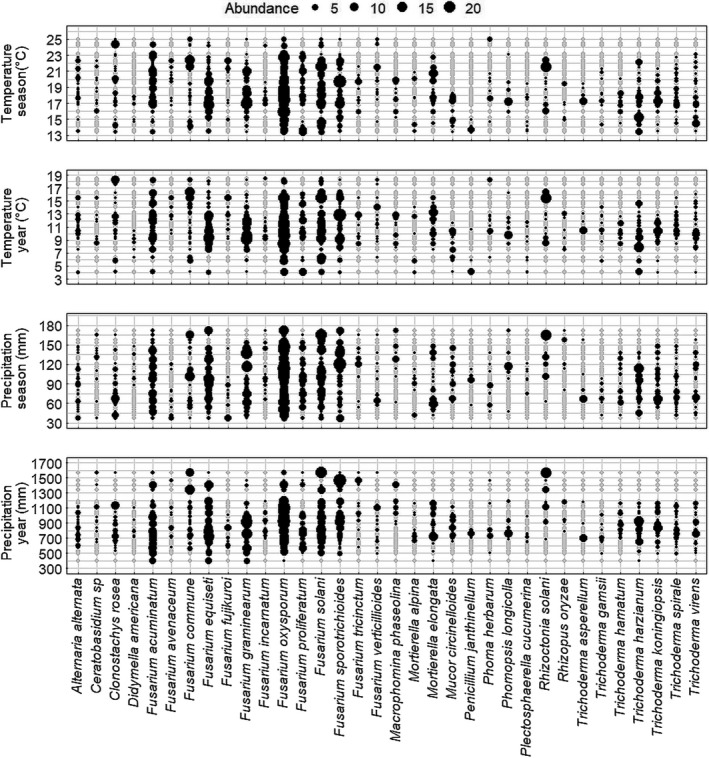
Distribution of the abundance of the top isolated fungal species across the temperature and precipitation gradients measured at the beginning of the growing season (April to July) and as a year average

Distribution of the abundance of the top isolated fungal species across the temperature and precipitation gradients measured at the beginning of the growing season (April to July) and as a year average