
FIGURE 3.
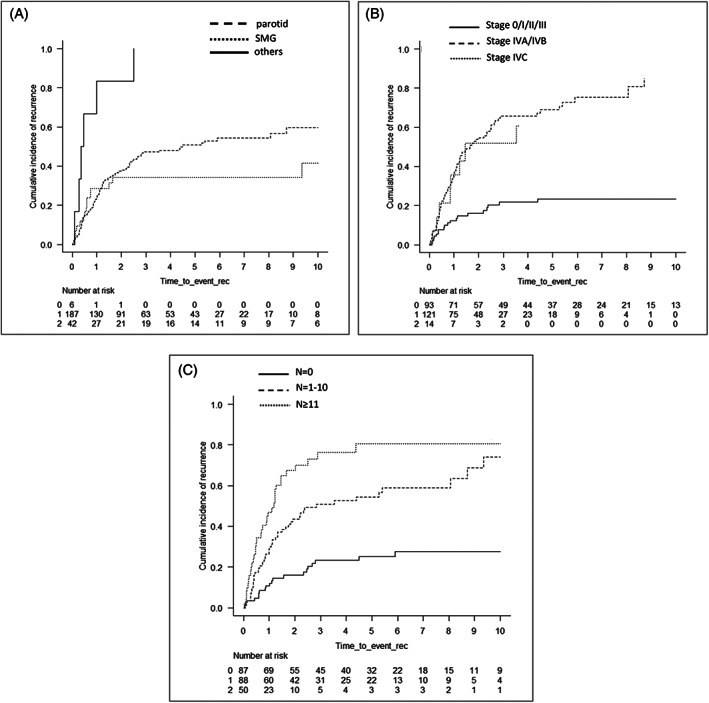
Cumulative incidence of relapse (CIR) curves according to each prognostic factor identified in the univariate analysis and multivariate Fine‐Gray proportional hazard regression model. CIR according to the site (A) (p < 0.001), pStage (B) (p < 0.001) and number of LN metastasis (C) (p < 0.001)