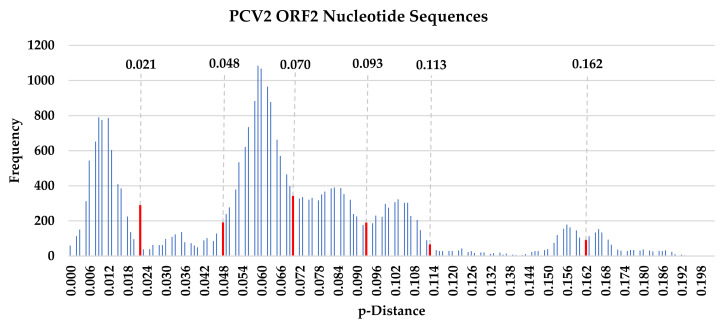
Figure 1.
PASC analysis of PCV2 cap gene nucleotide sequences. Pairwise sequence comparison for PCV2 cap gene nucleotide sequences were calculated based on pairwise p-distances within a 0.01 p-distance interval. PASC distance thresholds were previously used to define PCV2a and PCV2b genotypes. Seven distance thresholds ranging from 0.021 to 0.162 were identified in this multimodal curve, denoted by red lines.

