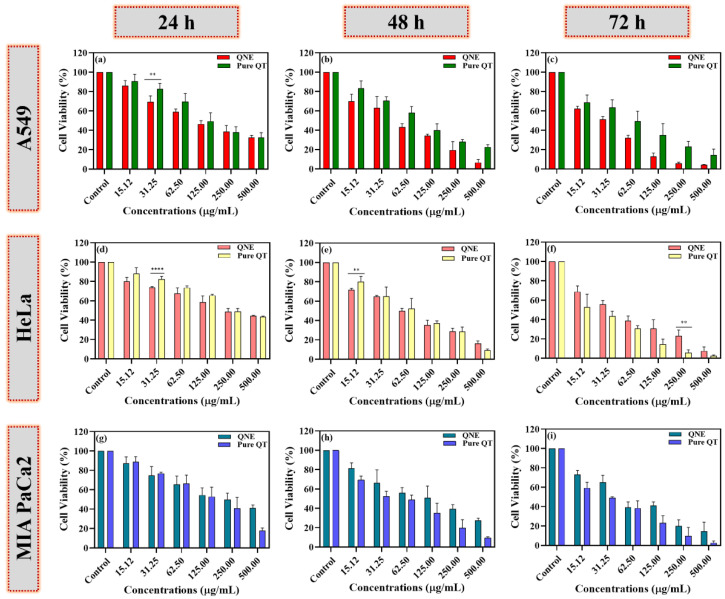
Figure 6.
The percentages of cell viability of free QT- and QNE-treated cells were calculated in a dose- and time-dependent manner using the MTT test on different human cancer cells: A549 (a–c), HeLa (d–f), and MIA PaCa-2 cells (g–i). The data were analyzed using GraphPad Prism 9.0 software and represented as mean ± SD (n = 3). The obtained results for pure QT and QNE were further examined using multiple t-tests. The p-values are signified as ** p < 0.01, **** p < 0.0001.

