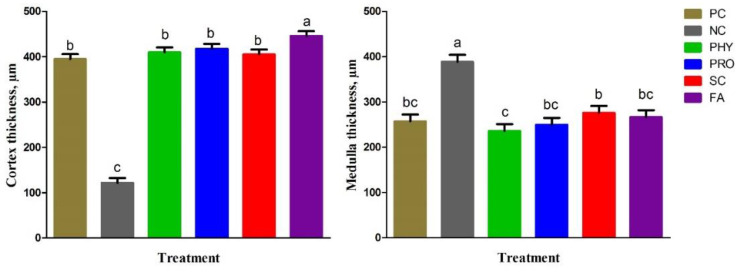
Figure 2.
Effect of dietary treatments on cortical bone thickness and medullary area of tibia in broiler chickens at 35 d of age. Data represented as mean ± SEM. a–c Means with different letters varied at p ˂ 0.05. For treatment abbreviations, see Table 2.

