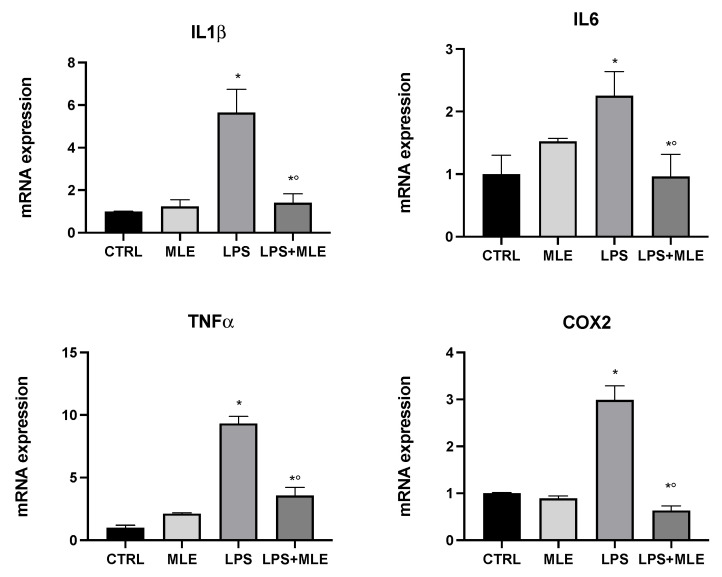
Figure 4.
Gene expression in the macrophages of interleukin-1β (IL-1β), interleukin-6 (IL6), tumor necrosis factor-α (TNF-α), and cyclooxygenase-2 (COX-2) evaluated by RT-PCR. Bars represent the mean ± SEM of six independent experiments. * p < 0.05 versus undifferentiated cells; *° p < 0.05 versus differentiated cells.

