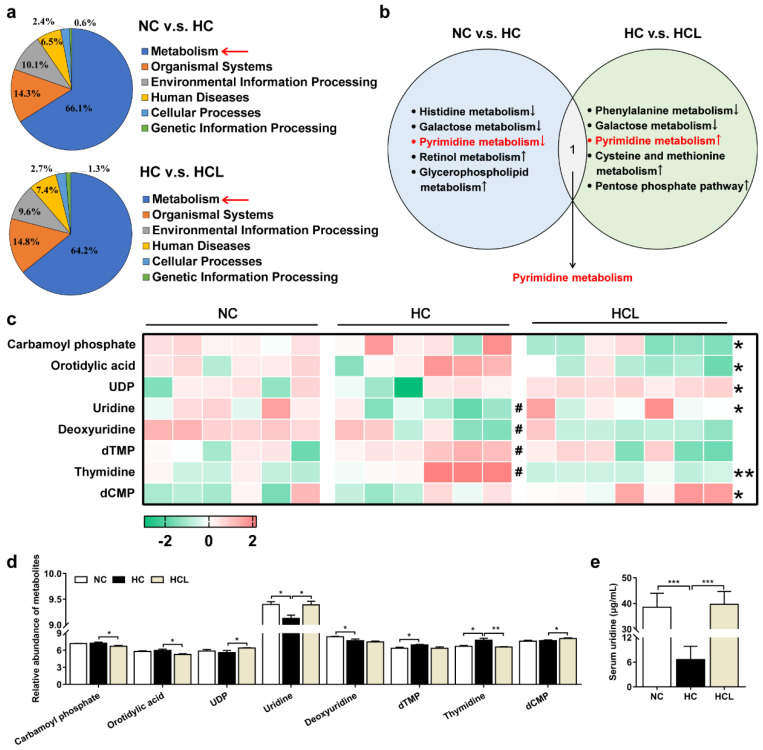
Figure 3.
L. plantarum MR1 modulated the metabolic patterns in Nile tilapia. (a) Identification of differentially biological processes percentage in the HC-treated fish compared with the NC-fed fish or in L. plantarum MR1-treated fish compared with the HC-treated fish by liquid chromatography–mass spectrometry (LC–MS) analysis. (b) Annotation of the identical significant altered metabolism pathway in the three groups. (c) Heat map of selected differentially changed metabolites involved in pyrimidine metabolism (#, NC v.s. HC; *, HC v.s. HCL, #, p < 0.05, *, p < 0.05, **, p < 0.01). (d) Histogram statistics of differential metabolites in the heat map. (e) The contents of serum uridine detection by high performance liquid chromatography (HPLC); n = 6 in NC and HC groups and n = 7 in HCL group. Statistics were analyzed by one-way ANOVA with Tukey’s adjustment and presented as mean ± SEM (*, p < 0.05; **, p < 0.01; ***, p < 0.001).

