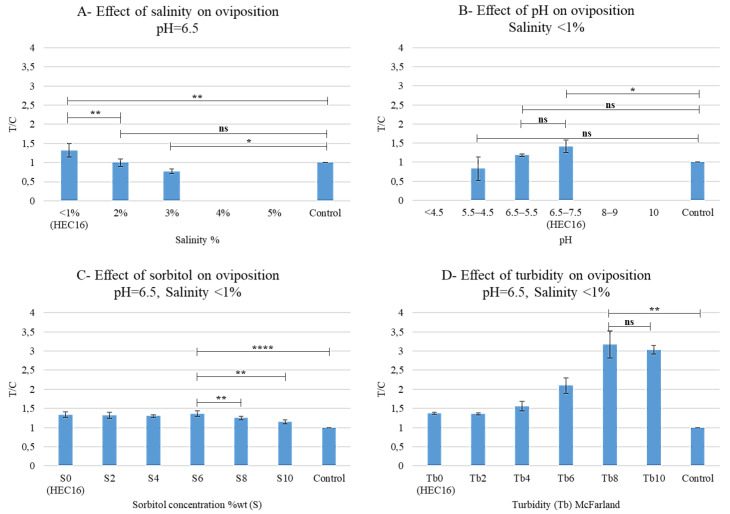
Figure 3.
Oviposition assay 2: Effects on oviposition preferences of salinity (A), pH (B), Sorbitol concentration, S (C), and turbidity Tb (D). Paper was used as control. T/C is the ratio between eggs laid on sample (T) and control (C). All the tests were carried at 25 °C and 80% of relative humidity (RH). Statistical analysis legend: p > 0.0123 = not significant (ns); p < 0.033 = *; p < 0.0021 = **; p < 0.0001 = ****.

