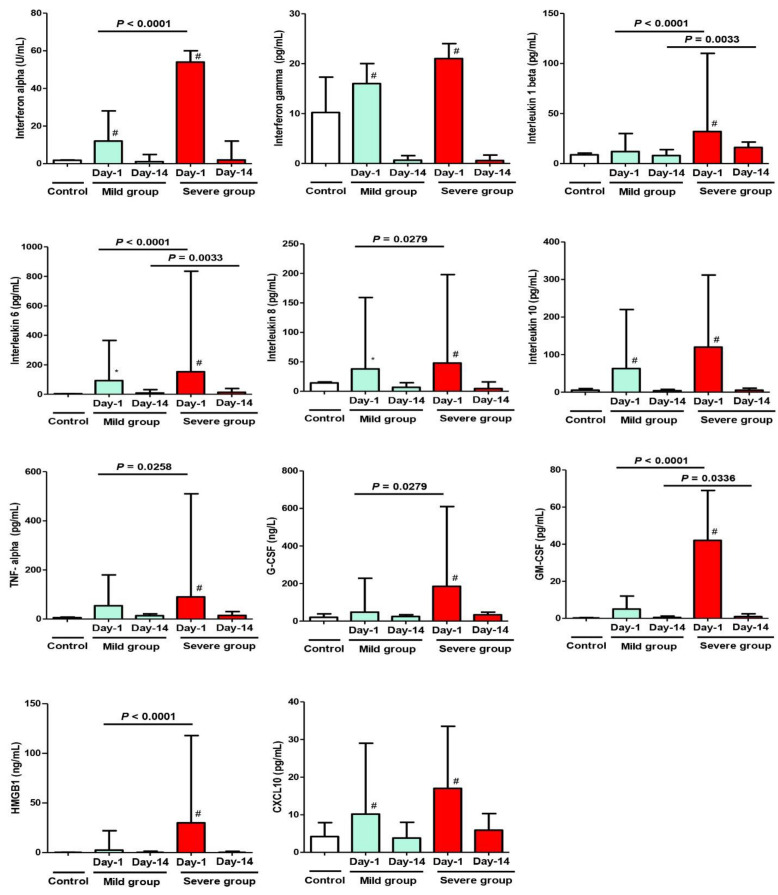
Figure 4.
Cytokine analysis at Day 1 and Day 14 after admission with MIS-C manifestations. Control Group = Simple COVID-19 infection; Group A = Mild MIS-C; Group B = Severe MIS-C. * p < 0.05 and # p < 0.01, statistically significant difference compared to the control group (one-way ANOVA followed by Tukey’s post-test).

