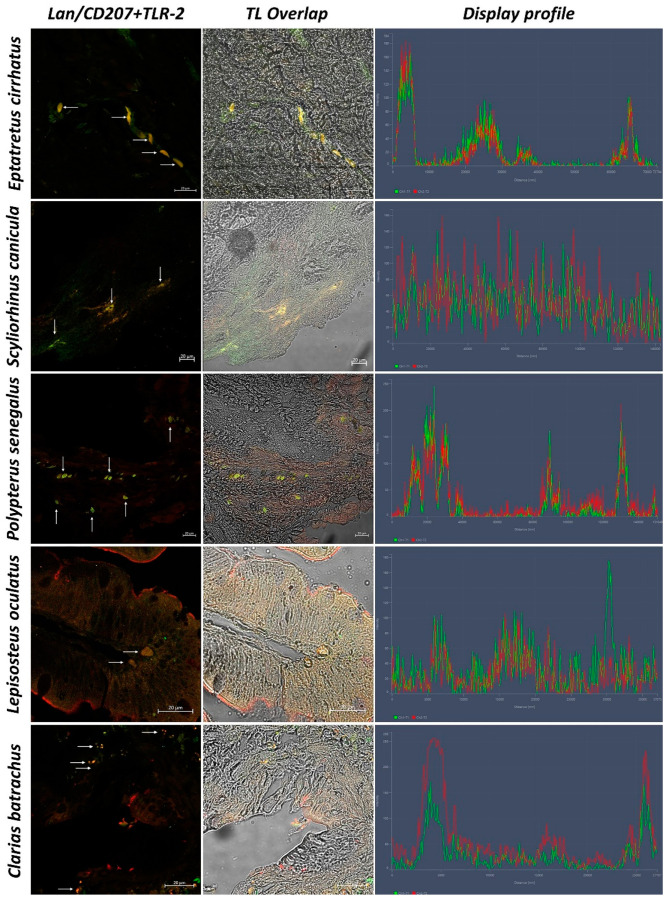
Figure 7.
Colocalization of Langerin/CD207 and TLR-2, 40×, scale bar 20 µm. The colocalization of Langerin (green) and TLR-2 (red) is evident (arrows). Overlap in Transmitted Light (TL) is used to compare the organ morphology. The “display profile” function was used to confirm the antibodies colocalization.

