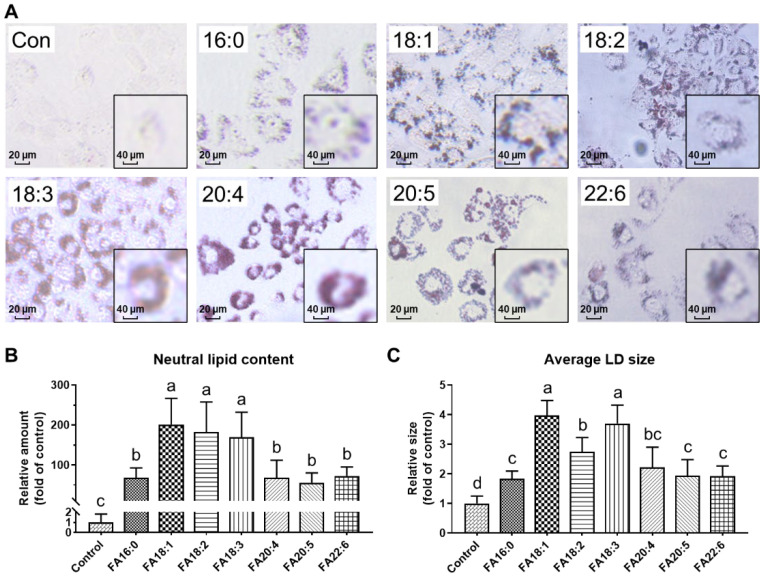
Figure 2.
Neutral lipid accumulation in HK-2 cells treated with different fatty acids: 16:0, 18:0, 18:1, 18:2, 18:3, 20:4, 20:5, or 22:6. (A) Lipid droplet morphology, obtained by oil red O staining. (B) Area of the lipid droplets. (C) Size of the lipid droplets. a–d, bars with different letters differ at p < 0.05, calculated by one-way ANOVA with Tukey’s post hoc test.

