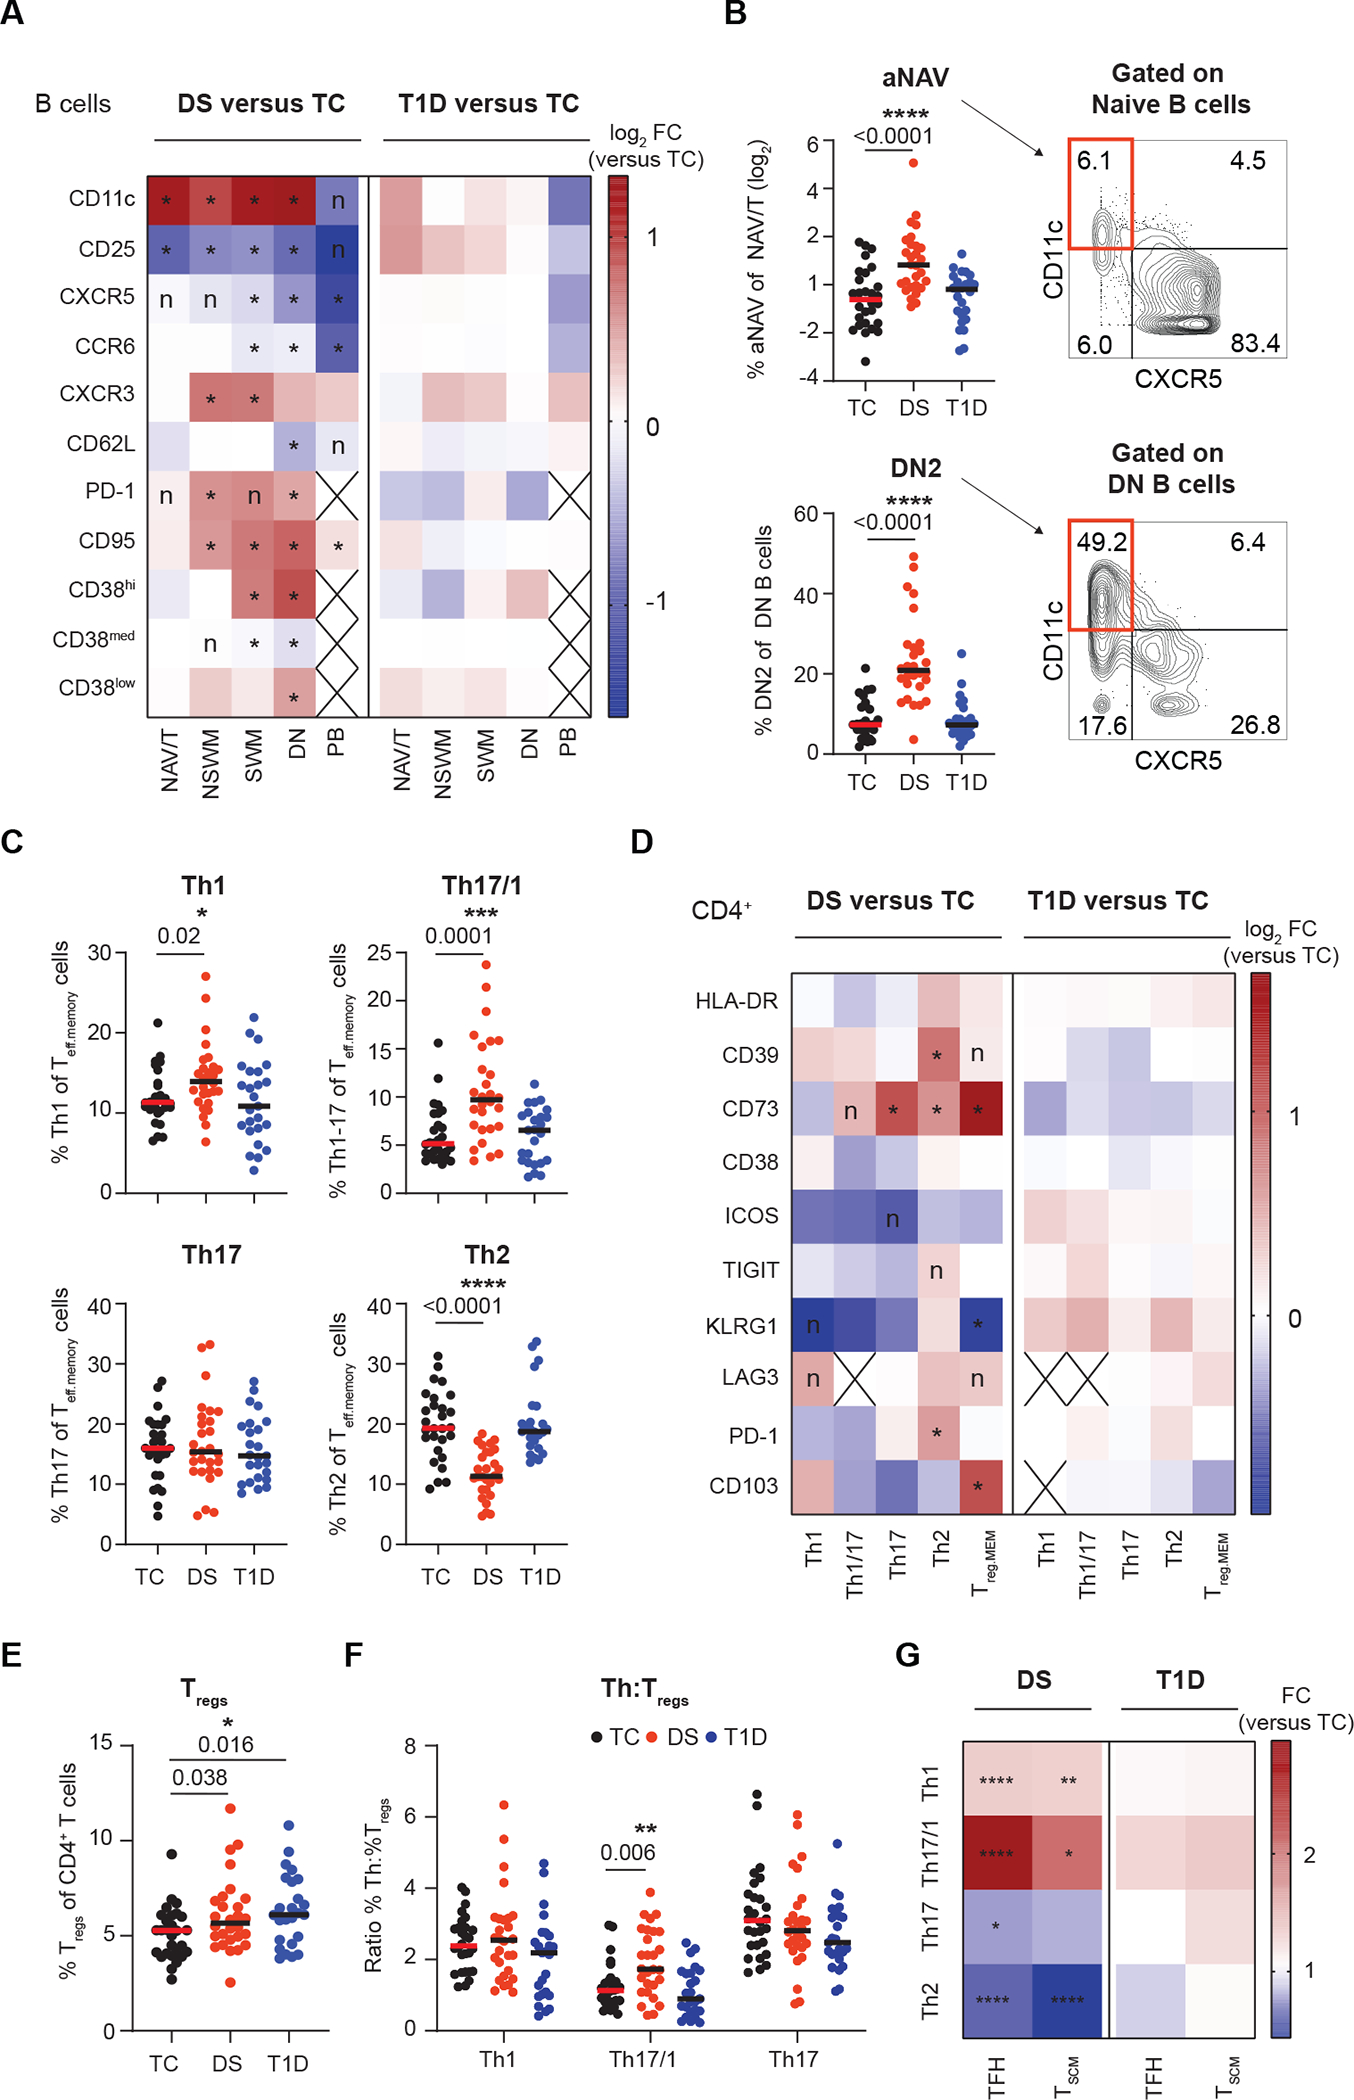
Fig. 3. Remodeling of B and T cell compartments in individuals with DS shows autoimmunity-related features.

(A) IMPACD compares expression of selected markers in each B cell memory subset in samples from individuals with either DS or T1D versus controls (TC). NAV/T, naïve/transitional; NSWM, non-switched memory; SWM, switched memory; DN, double negative; PB, plasmablast. (B) Frequency of autoimmunity-related activated naïve (aNAV) and DN2 B cells (amongst naïve and DN B cells respectively) in each cohort are shown. The gating strategy is shown on the right. (C) Frequencies of Th subsets are shown among non-TFH (CXCR5−) CD45RO+ Teffs (Teff.memory) in each cohort. (D) Expression of selected markers in Th subsets is shown in either DS or T1D versus TC. Treg.mem indicates memory Tregs. (E) Frequency of Tregs (CD127lowCD25hi) amongst CD4+ T cells are shown in each cohort. (F) Ratio of Th1, Th17/1 and Th17 cell frequencies to Treg frequencies are shown for each cohort. (G) Frequency of Th subsets within total TFH (T follicular helper, CXCR5+CD45RO+ CD4+ Teff) or TSCM cells from people with DS or T1D are shown as fold change (FC) relative to TCs. (A to G) n = 28 TC, n = 28 DS, n = 25 T1D, across 5 batches. (A, D, and G) Heatmap shows the ratio of median percentage of marker-expressing cells. (A and D) Wilcoxon ranksum test with Benjamini-Hochberg correction was used; *, FDR-adjusted p<0.05; n, nominal p<0.05; cross (X), the median number of cells in that group was < 10. (B, C, E, and F) Asterisks indicate statistical significance by Kruskal-Wallis test (*, p<0.05; **, p<0.01; ***, p<0.001; ****, p<0.0001). Posthoc Mann-Whitney tests were used; p-values are shown. (G) Mann-Whitney test, * p<0.05, **p<0.01,*** p<0.001, **** p<0.0001.
