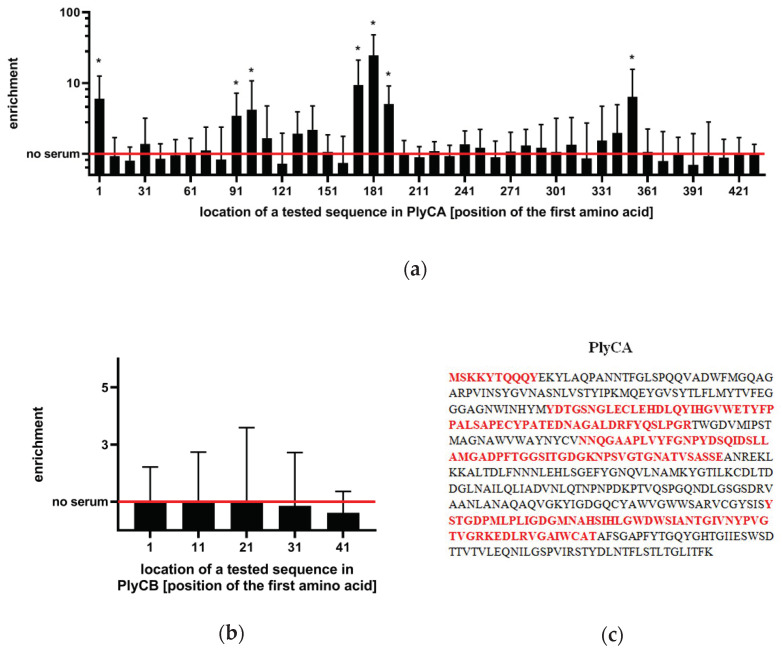
Figure 3.
Immunogenic regions in PlyC. (a) Enrichment ratios within PlyCA subunit. (b) Enrichment ratios within PlyCB subunit. Red lines in panels a and b represent the signal of the ‘input sample’ (that is: the library before immunoprecipitation), normalized as 1.0 (c) Estimated immunogenic regions in PlyCA sequence (in red) are presented. The immunogenicity of PlyC regions was defined in the reaction of a phage display library containing PlyC-derived oligopeptides (10 aa shift) with murine sera. Mice were immunized with PlyC (100 µg/mouse in 0.2 mL), and PlyC-specific serum was used for immunoprecipitation. NGS was used to identify the immunoprecipitated fraction of the phage display library. The enrichment ratio of PlyC-representing oligopeptides after immunoprecipitation is presented, indicating the relative strength of interaction. *, adj. p < 0.01 from the comparison of normalized signals between the immunoprecipitated sample and the input sample, for each oligopeptide. Datapoints represent the average and the SD of 6 biological replicates (n = 6). Two technical replicates were completed.

