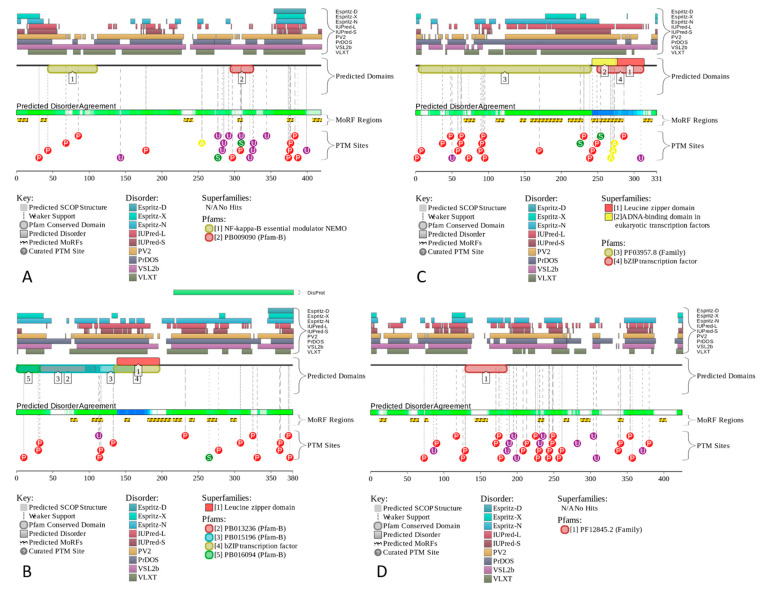
Figure 6.
The functional disorder profiles generated for IKKγ (A), c-FOS (B), Jun (C), and TANK (D) using the D2P2 platform (http://d2p2.pro/ accessed on 7 July 2022). In addition to the outputs of nine disorder predictors, the positions of the conserved functional domains, consensus disorder score, and positions of the various PTMs, this plot also includes the locations of the predicted disorder-based binding sites (MoRF regions) identified by the ANCHOR algorithm [157] (shown by the yellow zigzagged bars).

