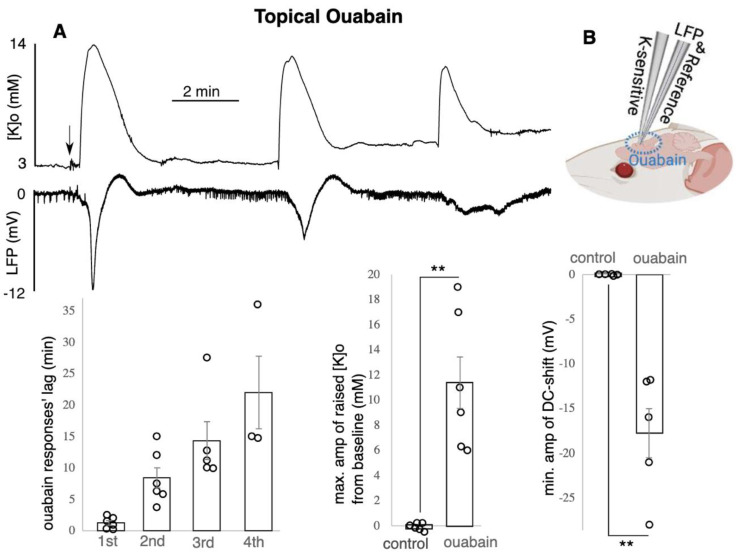
Figure 5.
Ouabain led to raised [K]o and DC-shifts. (A) Recurrent peaks in [K]o and dips in LFP shown on top and the data shown in the bottom (n = 6), only max. of the raised [K]o and min. of the DC-shift amplitude was included in the average calculation, two to four recurrent responses occurred per animal: the time between drug application till appearance of each of the recurrent responses is reported as “responses’ lag”. Raised [K]o amplitude was calculated by subtracting the peak from the baseline [K]o such that the reported value is the difference. (B) experimental configuration. ** indicates significance (p < 0.01), amp = amplitude, min = minutes, max. = maximum, min. = minimum. Circle presents individual data.

