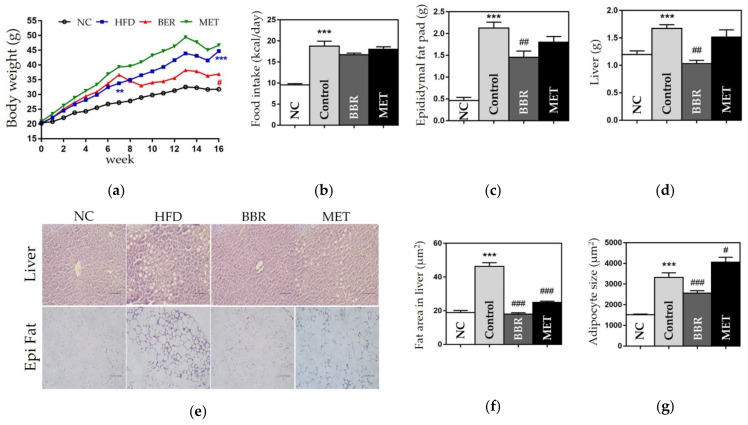
Figure 3.
Changes in body weight, organ weight, and epididymal fat pads weight, and the fat area in the liver. (a) Body weight; (b) Food intake; (c) Epididymal fat pads weight; (d) Liver weight; (e) Histological results of the liver and epididymal fat pads; (f) Fat area in the liver; and (g) The size of adipocyte. In histological images stained by hematoxylin and eosin (H&E), the scale bar indicates 5 μm in the liver and 100 μm in the epididymal fat. Data are presented as mean ± standard error of the mean (SEM). *** p < 0.001 vs. the NC group and # p < 0.05, ## p < 0.01 and ### p < 0.001 vs. the control group. NC: normal chow, HFD: high fat diet, BBR: berberine, MET: metformin.

