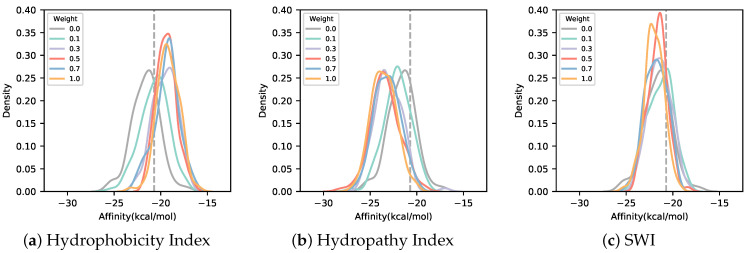
Figure 5.
Distribution of binding affinity for various weights of sequences designed in AfDesign using three solubility indices. The binding affinity of sequences designed in AfDesign using the Hydrophobicity Index (a), Hydropathy Index (b), and Solubility-Weighted Index (SWI) (c) as solubility indices in the loss function. Each color indicates the weight of the solubility loss. The gray line with a weight of 0.0 shows the distribution of binding affinity for the sequence designed by AfDesign without a solubility index. The dashed line shows the average of binding affinity of the p53 peptide.

