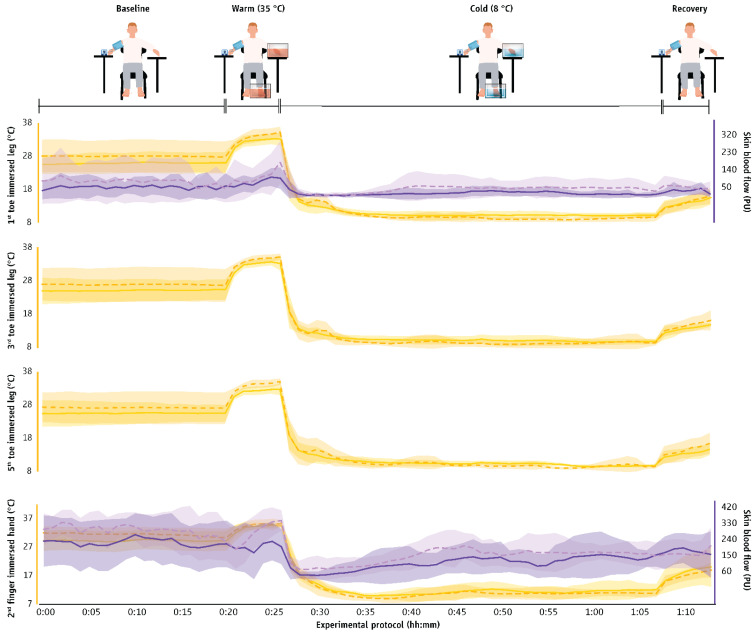
Figure A1.
Skin temperature and blood flow (mean ± SD) in the fingers and toes during exposure to the thermoneutral environment (23 ± 1 °C) in the two groups. The first 20 min (00:00 to 00:20) indicate data collected during the baseline phase, the next five min (00:20 to 00:25) indicate responses during the warm-water immersion, the next 40 min (00:30 to 00:70) indicate responses during the cold-water immersion, and the final five min (00:70 to 00:75) show responses during the recovery phase. Finger and toe temperatures are indicated with continuous yellow lines in men and with dashed yellow lines in women. Finger and toe skin blood flow data are indicated with continuous purple lines in men and with dashed purple lines in women.

