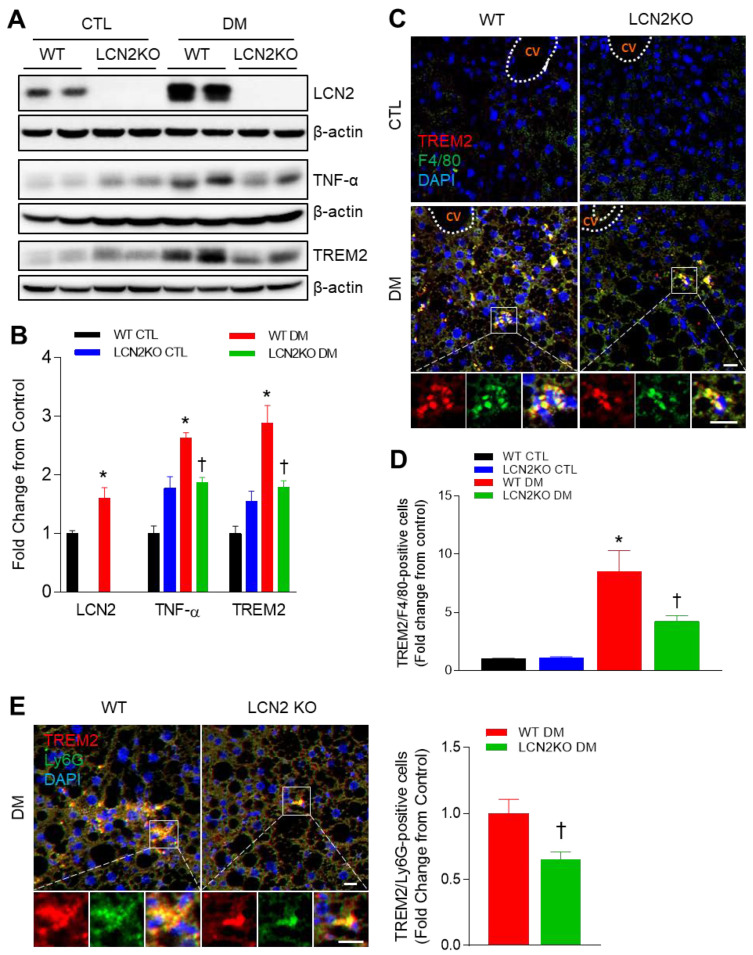
Figure 3.
Effects of LCN2 deletion on hepatic TREM2 expression in HFD/STZ-induced diabetic mice: (A,B) Western blot analysis and quantitation of LCN2, TNF- α, and TREM2 proteins in liver lysates. β-actin was used as loading control; (C) representative immunofluorescence images of TREM2 (red) and F4/80 (green) in liver sections; CV: central vein; (D) quantification of co-localized TREM2 and F4/80-immunostained cells in the images; (E) representative immunofluorescence images of TREM2 (red) and Ly6G (green) in liver section; quantification of co-localized TREM2 and Ly6G-immunostained cells in the images; scale bar = 10 µm. DAPI (blue) was used to stain nuclei. CTL: control; DM: diabetic mice. Data are presented as the mean ± SEM. The indicated p-values represent a two-way ANOVA, followed by Tukey’s post hoc test. * p < 0.05 vs. WT CTL. † p < 0.05 vs. WT DM.

