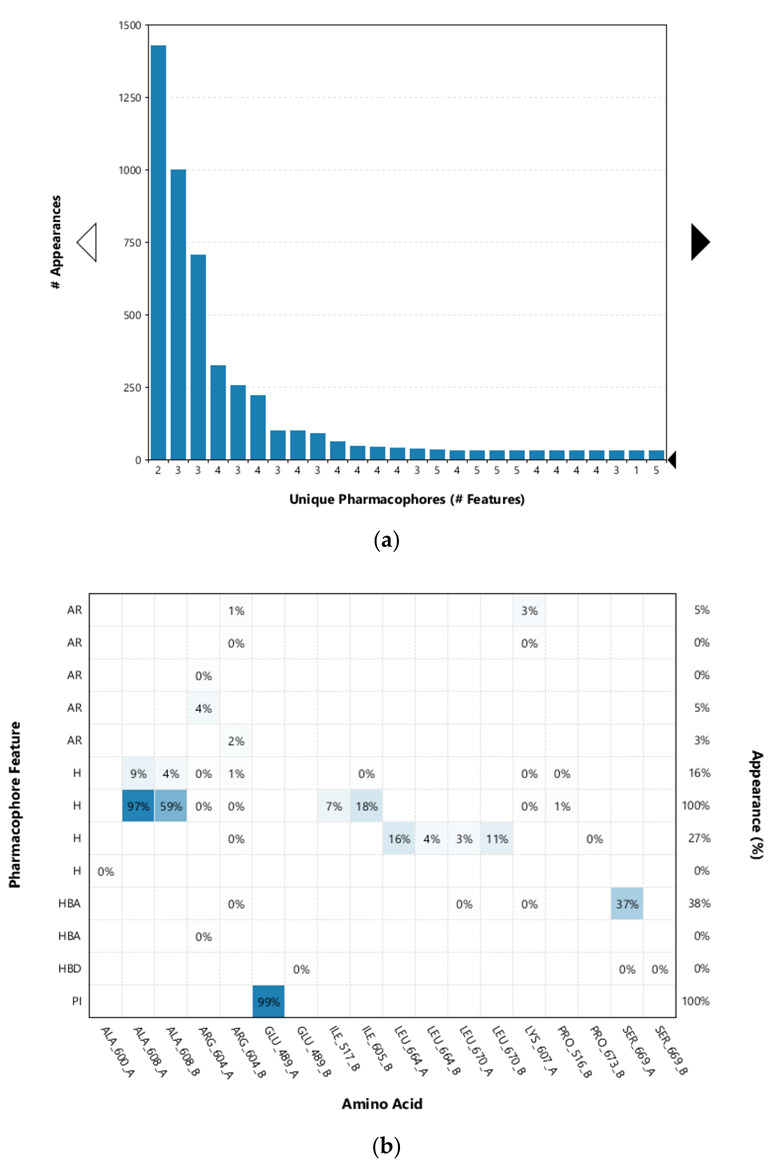
Figure 4.

(a) Plot of the most frequent unique structure-based pharmacophore models derived from the molecular dynamics simulations of the Hsp90 C-terminal domain in complex with TVS-23. The numbers below the bars indicate the numbers of interaction features observed during molecular dynamics simulation for the pharmacophore models. (b) MD Interaction map obtained by analysing interactions of TVS-23 with Hsp90 CTD binding site residues in the 1 µs MD simulation trajectory. Amino acid name and numbering is shown on x-axis, pharmacophore feature type on the left y-axis (H—hydrophobic, HBA—hydrogen bond acceptor, HBD—hydrogen bond donor, PI—positive ionizable, AR—aromatic), % appearance on the right y-axis.
