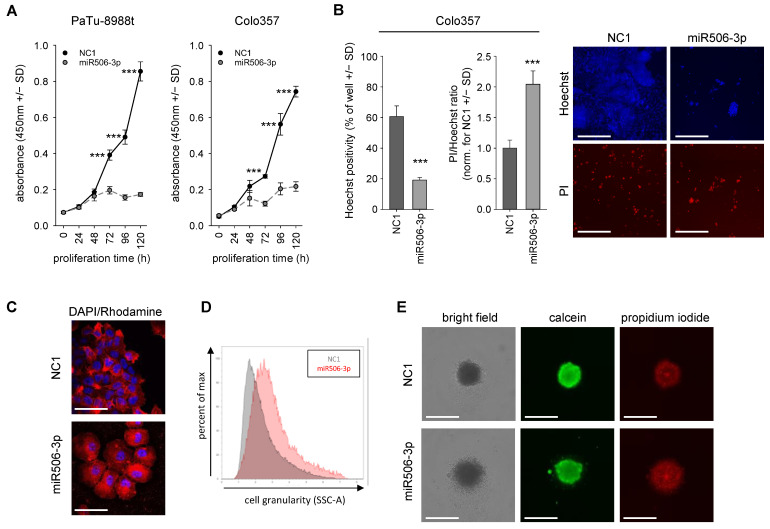
Figure 1.
(A) Two-dimensional proliferation assay in PaTu-8988t and Colo357 cells after miR506-3p (gray, dashed) vs. negative control (NC1) transfection (black). (B) Effect of miR506-3p on cell death, visualized by propidium iodide (PI) staining for dead cells, with Hoechst counterstaining for nuclei and cell number. (C) Confocal imaging of miR506-3p effect on flattened cell morphology, with DAPI nuclear staining and phalloidin-rhodamine cytoskeletal staining. (D) Flow cytometry-based analysis of cell granularity after miR506-3p (red) vs. NC1 transfection (gray). (D) Altered surface shape of Panc89 spheroids, pre-transfected for 24 h with miR506-3p vs. NC1 and then cultivated for 72 h in low-adhesion plates. Spheroids are shown in bright field, as well as stained with calcein (viable cells) and PI (dead cells). Scale bars: (B) 300 µm; (C) 50 µm; (E) 200 µm. *** p < 0.001.

