Figure 3.
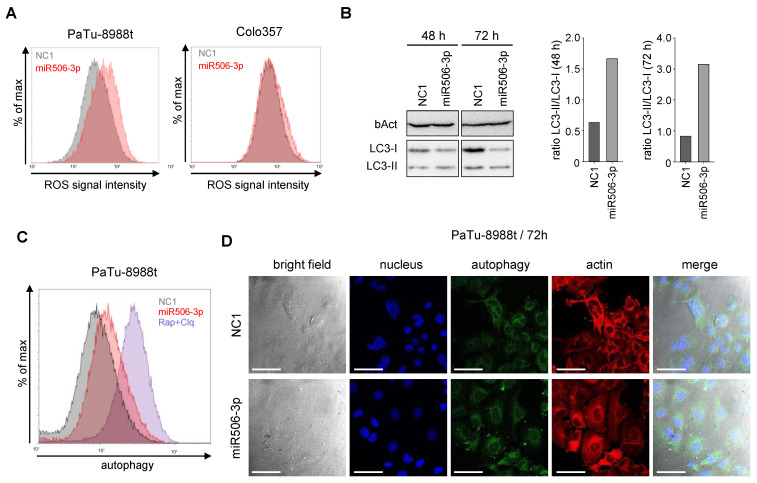
(A) Determination of ROS levels in PaTu-8988t (left) and Colo357 cells (right) by flow cytometry after transfection with miR506-3p (red) vs. NC1 (gray). (B) Time-dependent induction of autophagy upon miR506-3p, as determined by LC3-I/LC3-II Western blotting (left) and calculation of LC3-I/LC3-II ratios (right). (C) Induction of autophagy upon transfection of PaTu-8988t cells with miR506-3p (red) vs. NC1 (gray); blue: rapamycin + chloroquine as positive control. (D) Confocal microscopy of PaTu-8988t cells stained in parallel for autophagy (CYTO-ID® Autophagy Detection kit 2.0; green), actin (phalloidin-rhodamine) and nuclei (DAPI; blue), upon transfection with miR506-3p (lower panel) vs. NC1 (upper panel). Scale bars: 50 µm.

