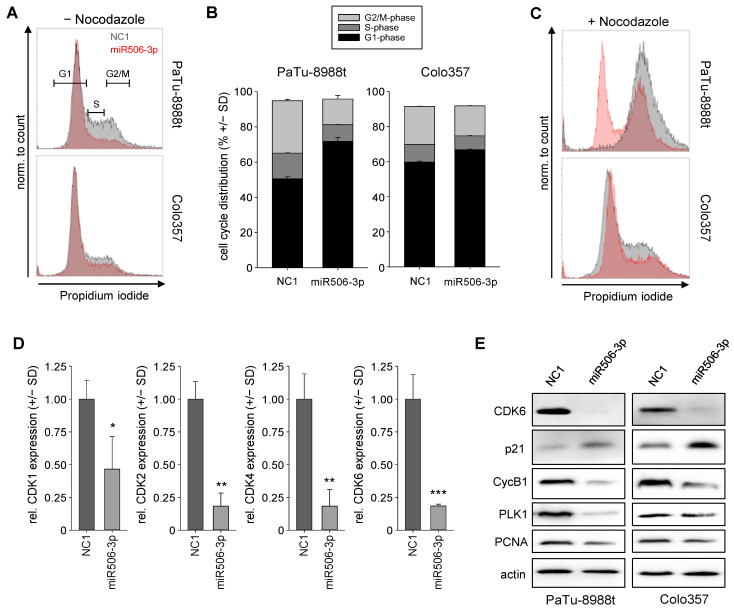
Figure 5.
(A) Analysis of cell cycle distribution in PaTu-8988t (upper) cells and Colo357 cells (lower panel) after miR506-3p (red) vs. NC1 transfection (gray). (B) Quantitation of cell cycle distribution in PaTu-8988t (left) cells and Colo357 cells (right). (C) Histograms of cell cycle distribution upon transfection of PaTu-8988t (upper) cells and Colo357 cells as above + treatment with nocodazole for inducing a G2/M arrest 52 after transfection and 20 h before analysis. (D) Relative mRNA levels of cell-cycle-related cyclins CDK1, CDK2, CDK4, and CDK6 after miR506-3p vs. NC1 transfection. (E) Western blot analyses of cell-cycle-related proteins in PaTu-8988t (left) and Colo357 cell lysates (right) after miR506-3p vs. NC1 transfection. * p < 0.05, ** p < 0.01 and *** p < 0.001.

