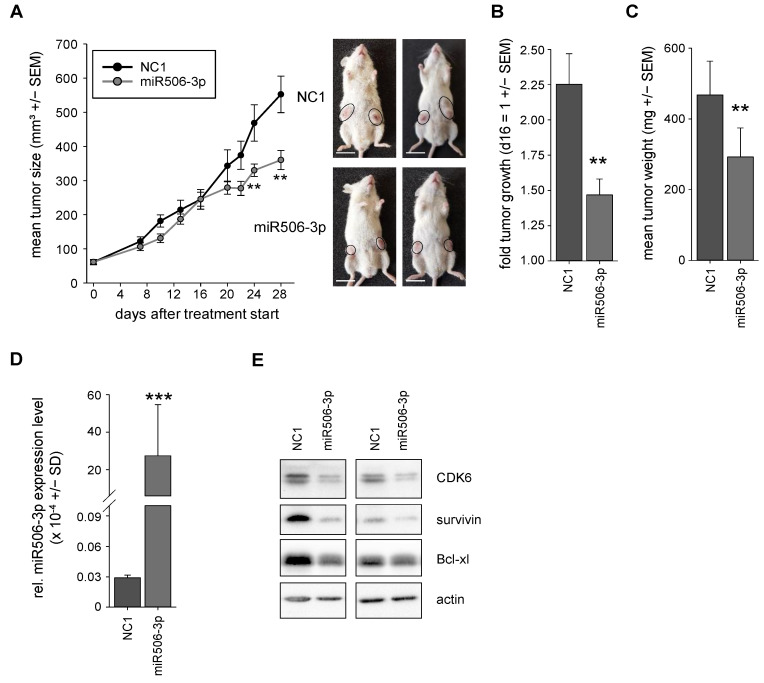
Figure 6.
(A) Tumor growth curves of the in vivo therapy study in PaTu-8988t xenograft-bearing mice, treated with PEI F25-LMW nanoparticle-formulated miRNA506-3p (gray) vs. negative control miRNA (NC1, black). Right: representative pictures of tumor-bearing mice. (B) Tumor growth after day 16 of the specific treatment groups NC1 and miR506-3p. (C) Results of weight measurements of explanted tumors for cross-validation of the tumor sizes after the end of the experiment. (D) MiR506-3p levels in the explanted tumor xenografts upon termination of the experiment for validation of miR506-3p delivery into the tumor. (E) Determination of various indirect targets of miR506-3p in the lysates of the explanted tumors. ** p < 0.01 and *** p < 0.001. Scale bar: (A) 1.5 cm.

