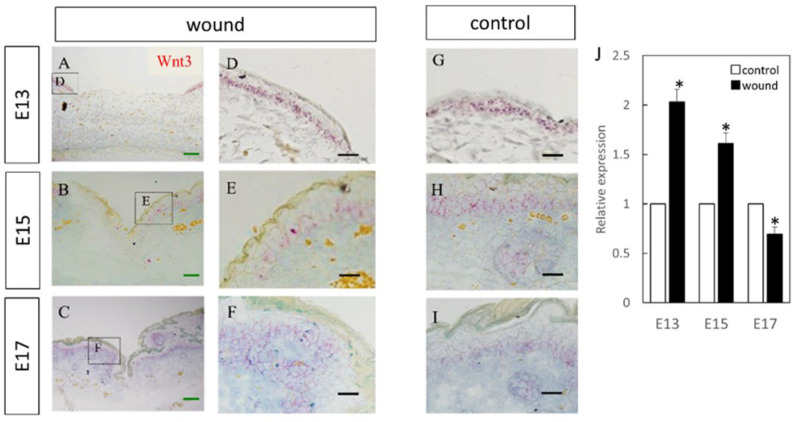
Figure 1.
Measurement of Wnt3 expression in the wound by in-situ hybridization and real-time quantitative PCR. Wnt3 expression is indicated in red in the tissue. Wnt3 was specifically expressed in the epidermal layer. (A–C) Weakly magnified images of the wound perimeter. (D–F) Strongly magnified images of the wound margin. (G–I) Observed images of the normal area. (J) Decreased expression of Wnt3 at the wound site compared to the normal site at E17. In contrast, Wnt3 expression was increased at the wound sites on E15 and E13. * p < 0.05. (A–C) Scale bar = 200 μm. (D–I) Scale bar = 100 μm.

