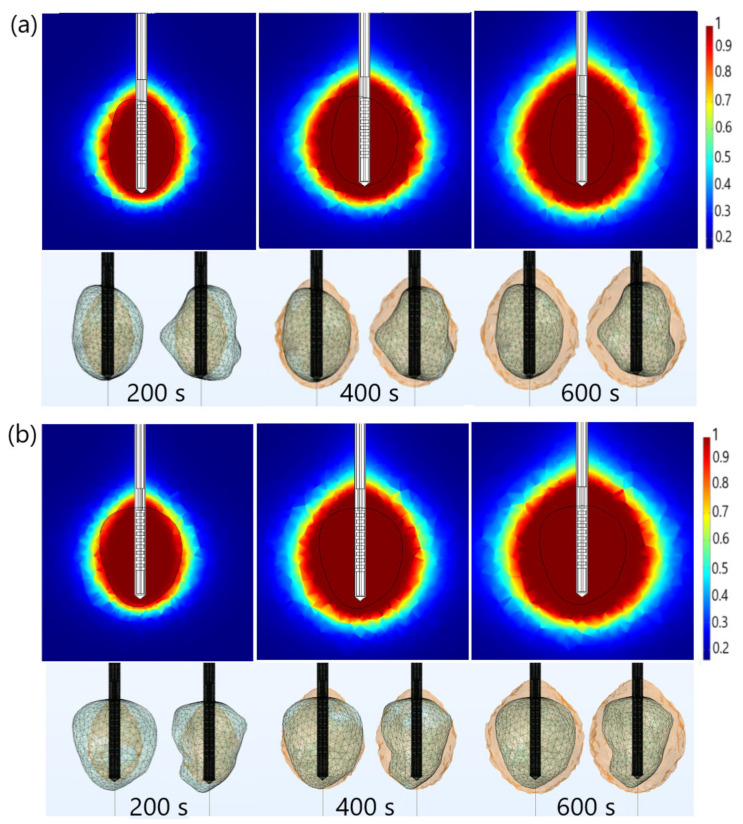
Figure 9.
The time evolution of the necrotic tissue of tumors (a) 1.07 [51] and (b) 1.03 [51], after 200 s, 400 s, and 600 s MWA at a frequency of 2.45GHz. The upper figures show the necrotic tissue in the cut plane (x = 0). The lower figures show the front and back sides of the tumors (triangulated surfaces).

