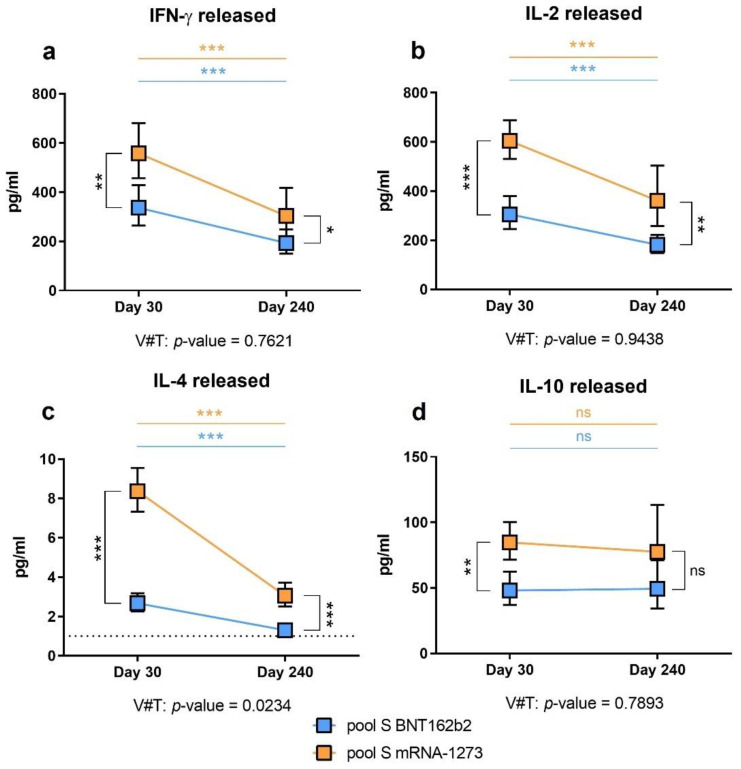
Figure 3.
Specific cellular immunity after stimulation with the S pool. The estimated means and confidence intervals were calculated by multiple linear regression model, adjusted by age and gender and with Bonferroni’s correction. Squares represent the mean and confidence intervals for IFN-γ (a), IL-2 (b), IL-4 (c), and IL-10 (d), at day 30 and 240, for BNT162b2 (in blue) and mRNA-1273 (in orange). Lower limit of detection (LLOD) is indicated by the dotted line for IL-4 (1 pg/mL). The evolution for each cytokine was assessed by the mixed-effects model. V#T indicates the interaction between the type of vaccine and the time evolution. Non-significant (ns = p-value > 0.05). * p-value < 0.05. ** p-value < 0.01. *** p-value < 0.001.

