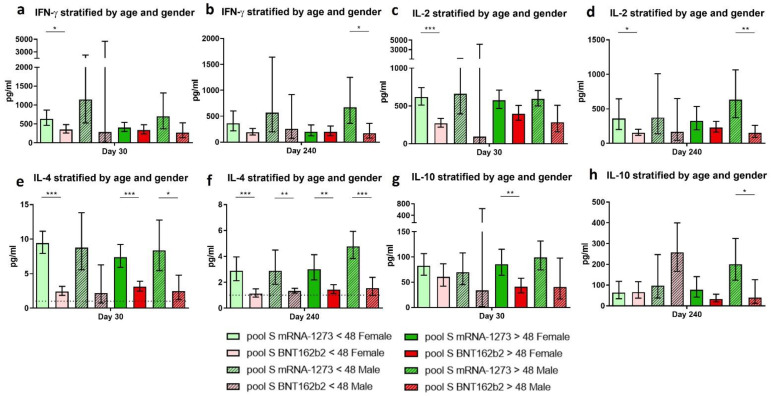
Figure 5.
Anti-SARS-CoV-2 spike specific cellular response regarding the individuals’ age and gender. The estimated means and confidence intervals were calculated by a multiple linear regression model, stratified by age and gender. Bonferroni’s correction was used. Bars represent the mean and confidence intervals for IFN-γ (a,b), IL-2 (c,d), IL-4 (e,f), and IL-10 (g,h), at day 30 and 240, respectively. Each graph represents volunteers vaccinated with mRNA-1273: women < 48 years (light green), women > 48 years (dark green), men < 48 years (striped light green), and men > 48 years (striped dark green). Volunteers vaccinated with BNT162b2: women < 48 years (light red), women > 48 years (dark red), men < 48 years (striped light red), and men > 48 years (striped dark red). Lower limit of detection (LLOD) is indicated by the dotted line for IL-4 (1 pg/mL). * p-value < 0.05. ** p-value < 0.01. *** p-value < 0.001.

